


GIS and Sustainability Engagement in Higher Education
Link to JSE General Issue February 2022 Table of Contents
Kmetz and Hickman JSE General February 2022 PDF
Abstract: Does the use of an interactive GIS web map significantly influence the level of sustainability stakeholder engagement at institutions of higher education? With over 1,000 institutions of higher education across the globe, the AASHE STARS report is one of the main tools available to sustainability professionals. For many institutions, the STARS report serves as a metric of sustainability progress and a source of new ideas and methods, while GIS provides a platform to display information within a context of systems, places, or times. Interactive web GIS allows for digital storytelling and can allow the user to explore specific information pertinent to their interests. This research explores potential links between the use of web GIS platforms and levels of campus engagement as measured by STARS.
Keywords: GIS, Web GIS, Engagement, STARS, Higher Education
Introduction
Geographic Information Systems (GIS) serves as a digital tool to leverage geographical and spatial contexts to manage, display, and understand information (ESRI, 2020). Utilization and deployment of GIS systems can vary significantly upon the discipline or sector managing the process and the intended consumers of the information (Pickles, 1995). Within the last 20 years, institutions and faculty within higher education have embraced GIS as an important pedagogical tool (Hwang, 2013). Coinciding with the implementation of GIS in higher education is the increasing interest among students for opportunities to learn more about sustainability both inside and outside of the classroom (Gramatakos & Lavau, 2019). This increasing curiosity of the subject leads sustainability practitioners, as noted by Bonney and Durham (2016), to begin “framing sustainability…within the context of sense of place [which] fosters a feeling of relevancy….[and] often results in positive behavior change.” Integration of the topic of sustainability is increasing across the higher education institutional landscape with its inclusion ranging from the residence hall to the syllabus (Cortese, 2003).
Sustainability, like GIS, is inherently linked to the complex interactions of multiple systems. There are multiple definitions and approaches to sustainability education and practice. (Klinsky et al., 2010)This creates a situation allowing for differing perspectives about sustainability to exist within an organization. (Stoughton & Ludema, 2012) The plethora of these nuances about the nature of sustainability can significantly impede an institution’s ability for effective communication of its own narrative. These different interpretations of sustainability serve as de facto hindrances of stakeholder engagement (Veland, 2018). Digital online tools, such as GIS maps and applications, offer a distinct mechanism allowing for the construction of a transparent, engaging, and institutional specific sustainability story (Elwood, 2006).
GIS maps are web-based interactive applications designed to communicate spatial information and digital narratives (Egiebor, 2019). The digital architecture of web-based GIS lends to an extremely user-friendly experience – both for end-users and creators. This type of platform allows for the relatively easily creation of a fully customizable and unique engagement experience that appeals to various stakeholders. Users of these maps are encouraged to explore systems-based narratives of linked maps, data, text, and media (Harder, 2015). This adaptable technology lends itself as a useful tool in the pursuit of the ultimate goal of higher education: engagement and education of students in learning. (Egiebor, 2019)
The Association for the Advancement of Sustainability in Higher Education’s (AASHE) Sustainability Tracking, Assessment & Rating System (STARS®) is a commonly utilized methodology by institutions of higher education to benchmark and measure progress in sustainability efforts. The goal of STARS, established in 2007, is to provide a transparent system for better understanding, communicating, and facilitating sustainability throughout higher education. The STARS process considers many data points related to an institution’s efforts within sustainability and provides a rating based upon various metrics in four broad categories: Academics, Engagement, Operations, and Planning & Administration (AASHE, 2019). The STARS reporting initiative allows for a unique look at emerging trends in sustainability. Participating institutions’ STARS ratings are valid for three years from the date of the original submission. This timeframe creates a condition where new data is consistently available for analysis.
The relatively nascent nature of both web-based interactive GIS and STARS reporting provides an opportunity to explore the potential effects GIS has on campus stakeholder engagement in the context of sustainability. This paper aims to determine any potential relationships between web-based GIS and higher levels of campus engagement. Specifically, we consider whether interactive GIS is an effective tool for institutions of higher education to improve web-based communication and engagement efforts about their sustainability story.
Materials & Methods
This study analyzed data submissions by higher education institutions to AASHE STARS. Specifically, the authors considered the data submitted under the evaluation “Campus Engagement” section (colloquially truncated to ‘EN’). The responses from this dataset enabled quantifying AASHE participating institutions utilizing a sustainability webpage and deploying an interactive, web-based, GIS solution. For the purposes of this study, the authors define interactive, web-based, GIS solutions as online platforms using geospatial technology and associated media allowing users to view and manipulate geographical points on campus and various campus information (e.g. data layers). Web features lacking an interactive GIS component were outside of the scope of this study.
STARS does not have a question specifically targeting the use of GIS solutions; however, the report does ask a question that targets maps in a sustainability context. Specifically, this study analyzed the responses to the question “EN-4: Outreach Materials and Publications.” The question set consists of several subsets of queries focused on specific areas of interest. The two topics of inquiry most pertinent to this study include: “[d]oes the institution have a central sustainability website that consolidates information about the institution’s sustainability efforts?” and “[d]oes the institution provide a sustainability walking map or tour?” In each case, those answering “yes,” are prompted to provide additional information. The optional additional information includes: the associated URL of the sustainability webpage, the URL of the sustainability walking map, and the URL associated with the walking map. The portion of the EN-4 question inquiring about a sustainability walking map or tour served as proxy for a specific question asking to share information about the use of GIS in a sustainability context (AASHE, 2019).
All institutions that provided a response to the EN-4 question set were included for analysis in this study. The STARS data was downloaded from the AASHE STARS webpage as a spreadsheet in September 2020. The first data analysis step involved data quality verification and removing any duplicates. Duplicates occur when an institution submits an additional STARS report prior to the three-year expiration. Some institutions choose to submit data annually. When an institution featuring a duplicate occurred, only the most recent STARS submission, based on the STARS version, received consideration. The historical STARS submissions, i.e. duplicates, were omitted from the study; thus yielding a distinct individual count of institutions comprising the total population study.
Next, each institution’s responses to EN-4 were qualified and quantified. Validation of each institution’s responses, independently by both authors, occurred via a webpage review to determine if a) the sustainability webpage was working (i.e. no broken links) and b) if a GIS solution was part of the institution’s sustainability efforts. The results were categorized by STARS institutional types into three different cohorts: working sustainability webpage and GIS solution, working sustainability webpage only, and no working sustainability webpage or GIS solution. Within those categories, the average EN score (i.e. points earned out of points available) was calculated and the scores were normalized as a percentage. The EN scores were then analyzed based on the institutional classification, the type of GIS technology used, and the digital architecture type (DAT) of the GIS solutions.
For the purposes of this research, the DAT includes four general categories: layer, digital map, story map, and virtual reality. The “layer” category consists of GIS solutions that exist as a single layer on a digital map. This category is associated with an institution’s main campus digital map which allows users to toggle layers of interest. Those considered “digital maps” are maps explicitly designed to only communicate information related to an institution’s sustainability initiatives. Story Maps can function as standalone resources, which combine maps, text, images, sounds, and videos to create a narrative. Virtual reality maps consist of a guided campus tour and provide a constant “street” view to immerse the user as if they were walking through the campus.
Results & Discussion
GIS Solutions Deployed
372 institutions, the total population for this study, answered the pertinent sections of EN-4 confirming whether the institution had a) a working sustainability webpage and if b) the institution had a sustainability walking map or tour. Table 1, provides a summary of the distribution of responses. 362 institutions affirmed the use of a sustainability webpage. The remaining 10 institutions left the question blank and did not provide any URL. 281 of the institutions who affirmed a sustainability webpage also indicated that they have a sustainability walking map or tour. The review of each institution’s response regarding the walking map or tour found that 77 of the institutions reported and deployed a GIS solution.
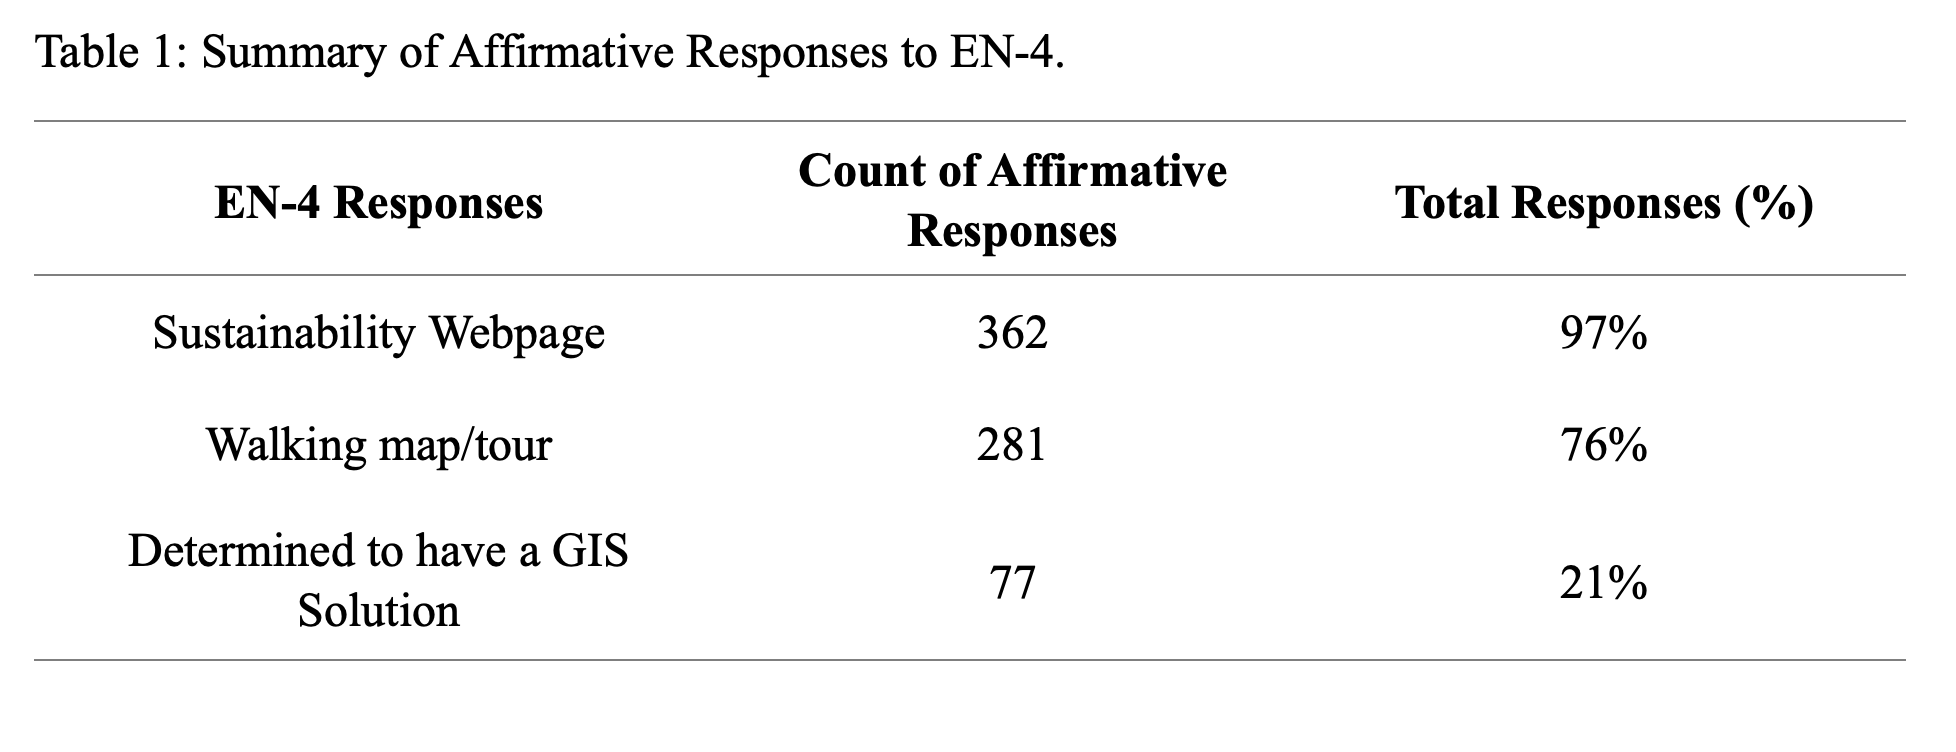
Table 1: Summary of Affirmative Responses to EN-4.
STARS Engagement and GIS Solutions
The data in Table 2 summarizes the results based on institutional classifications, EN-4 responses, EN points, and the overall EN score. Institutions that did not report a sustainability webpage and did not have a GIS solution have a lower average overall EN scores than their peers using those technologies. Institutions featuring both a webpage and GIS solution tend to have slightly higher average overall EN scores than peer institutions with only a webpage. Specifically, institutions classified as Associates, Baccalaureate, or Doctoral/Research featuring both a sustainability webpage and a GIS solution had higher average overall EN scores than peers only with a sustainability webpage. Master’s institutions are an outlier. When examining these institutions, those with just a sustainability webpage saw an overall average 2% higher score than those with both a sustainability webpage and GIS solution. A potential explanation for this discrepancy could be related to demographics of Master’s institutions.
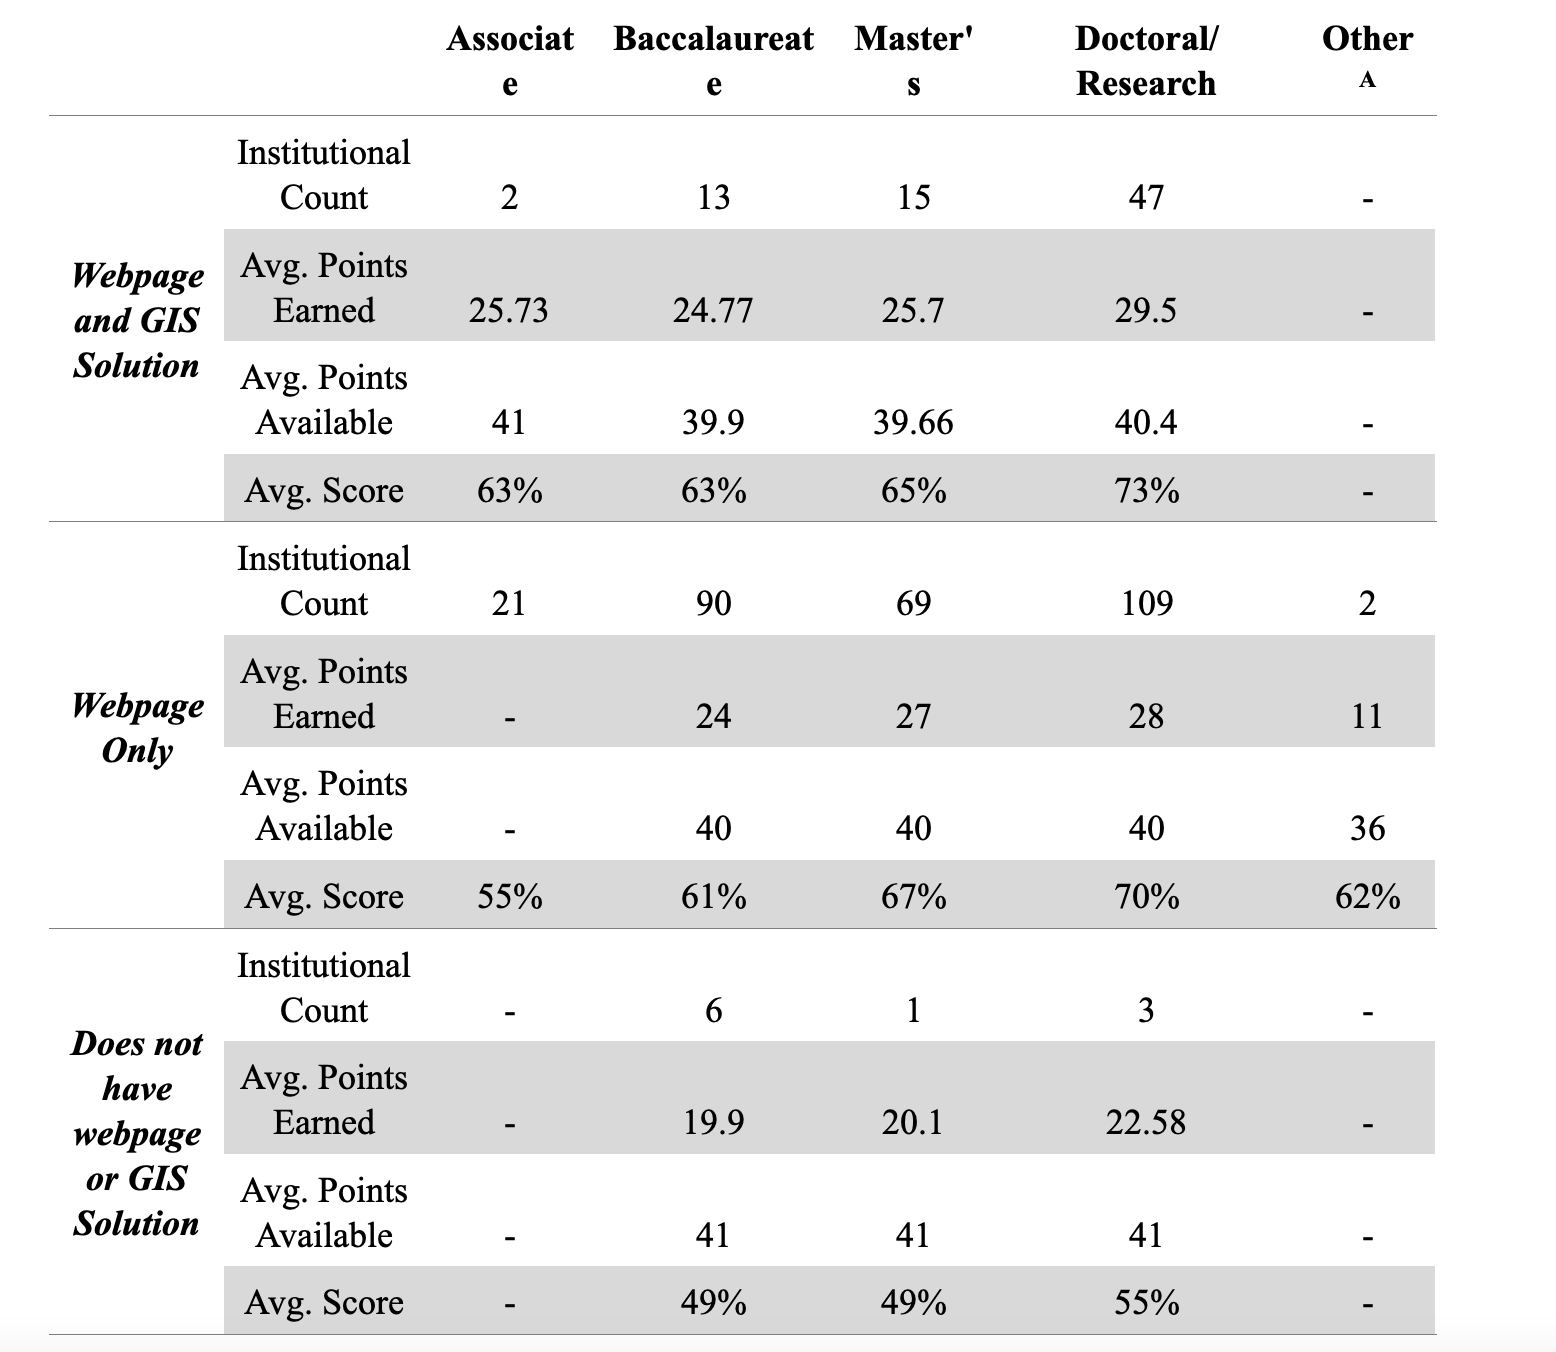
Table 2: Avg. EN Scores Based on Institutional Type and Reported Use of Web Technology
Notes: (A) Two institutions indicated “None” on their official AASHE submission
Deployment of GIS Solutions
Analysis of the 77 institutions with GIS solutions revealed that 91% of the institutions use one of four web-based geospatial platforms to host their GIS solution. The remaining 9% of institutions use less common technologies. As shown in Figure 1, Google Maps © and ArcGIS® are the most commonly utilized platforms for GIS solutions (used by 68% of the institutions) followed by Concept3D ©, Mapbox ©, and other less ubiquitous platforms. Google Maps was observed in more prevalent use at Baccalaureate and Master’s institutions. ArcGIS exhibited higher use at Doctoral/Research institutions. Only two Associates institutions had GIS solutions and each deployed a different platform.
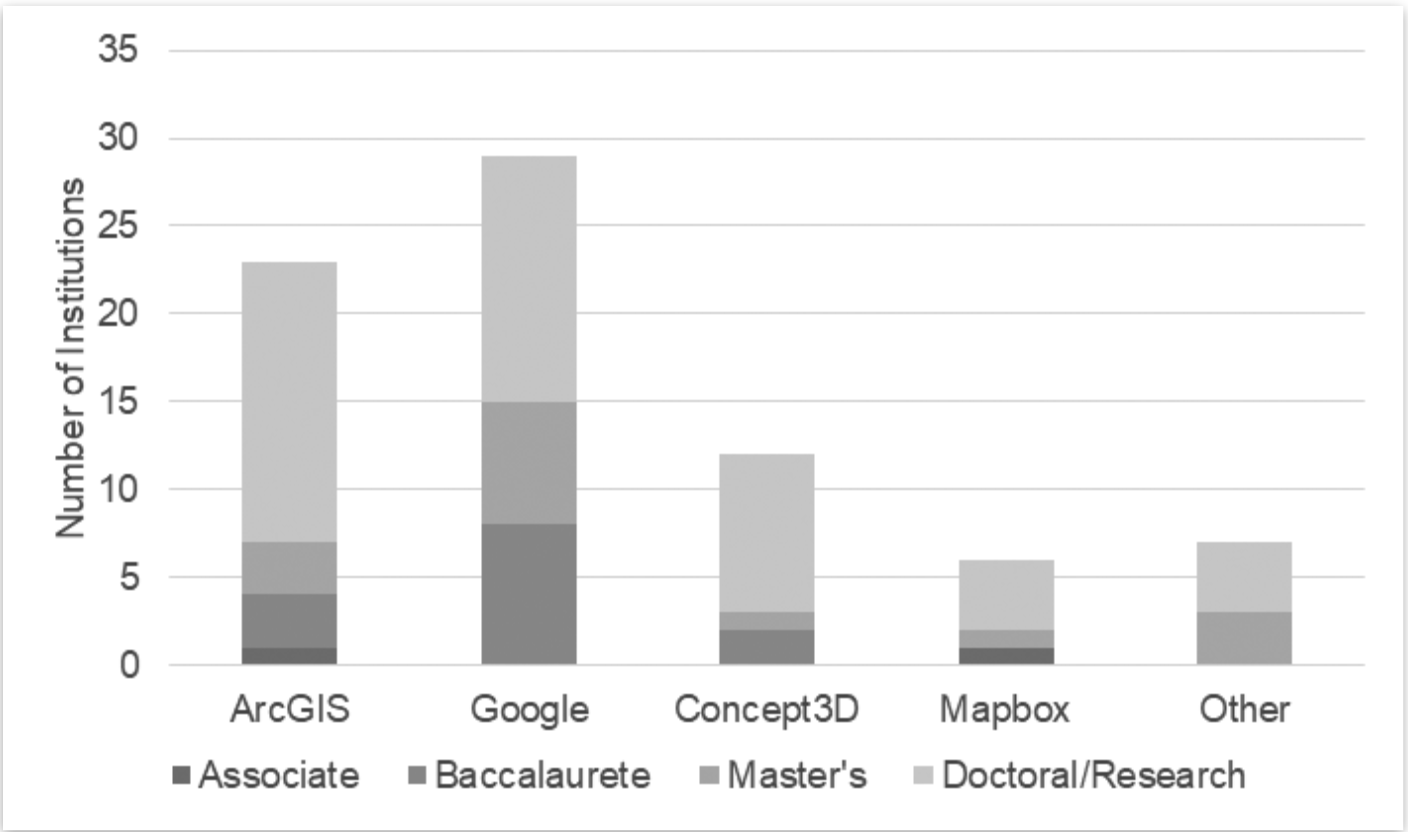
Figure 1. A summary of the types of technology used by institutional classifications.
The higher usage of Google Maps at Baccalaureate and Master’s institutions is potentially related to the ease of use associated with this technology and that Google Maps does allow for free mapping creation and design. The overall higher use of ArcGIS at Doctoral/Research institutions, possibly correlates with these institutions having well established GIS departments that provide instruction and training to students and employees. Such institutions potentially have more opportunities for multiple campus stakeholders to have the technical skills and the proper licensing to make and publish a GIS solution using ArcGIS tools. The lesser use of Concept3D and Mapbox may be associated with a steeper learning curve, higher associated fees, or a limit to the number of views in a period of time. The “other” solutions include custom built platforms for that specific institution’s use.
A review of EN scores by institutional classification and GIS solution type, summarized in Figure 2, revealed that while Google Maps is the most utilized platform by institutions, it is not associated with the highest average overall EN scores. Institutions with ArcGIS were associated with higher overall average EN scores compared to institutions using the other technologies, while those deploying a custom solution reported significantly higher average overall EN scores when compared to their peers. This variation may be attributed to the significant investment of resources associated with a unique institution’s specific GIS solution –i.e. greater number of stakeholders involved with a greater sense of ownership leading to broad use and distribution of the GIS solution.
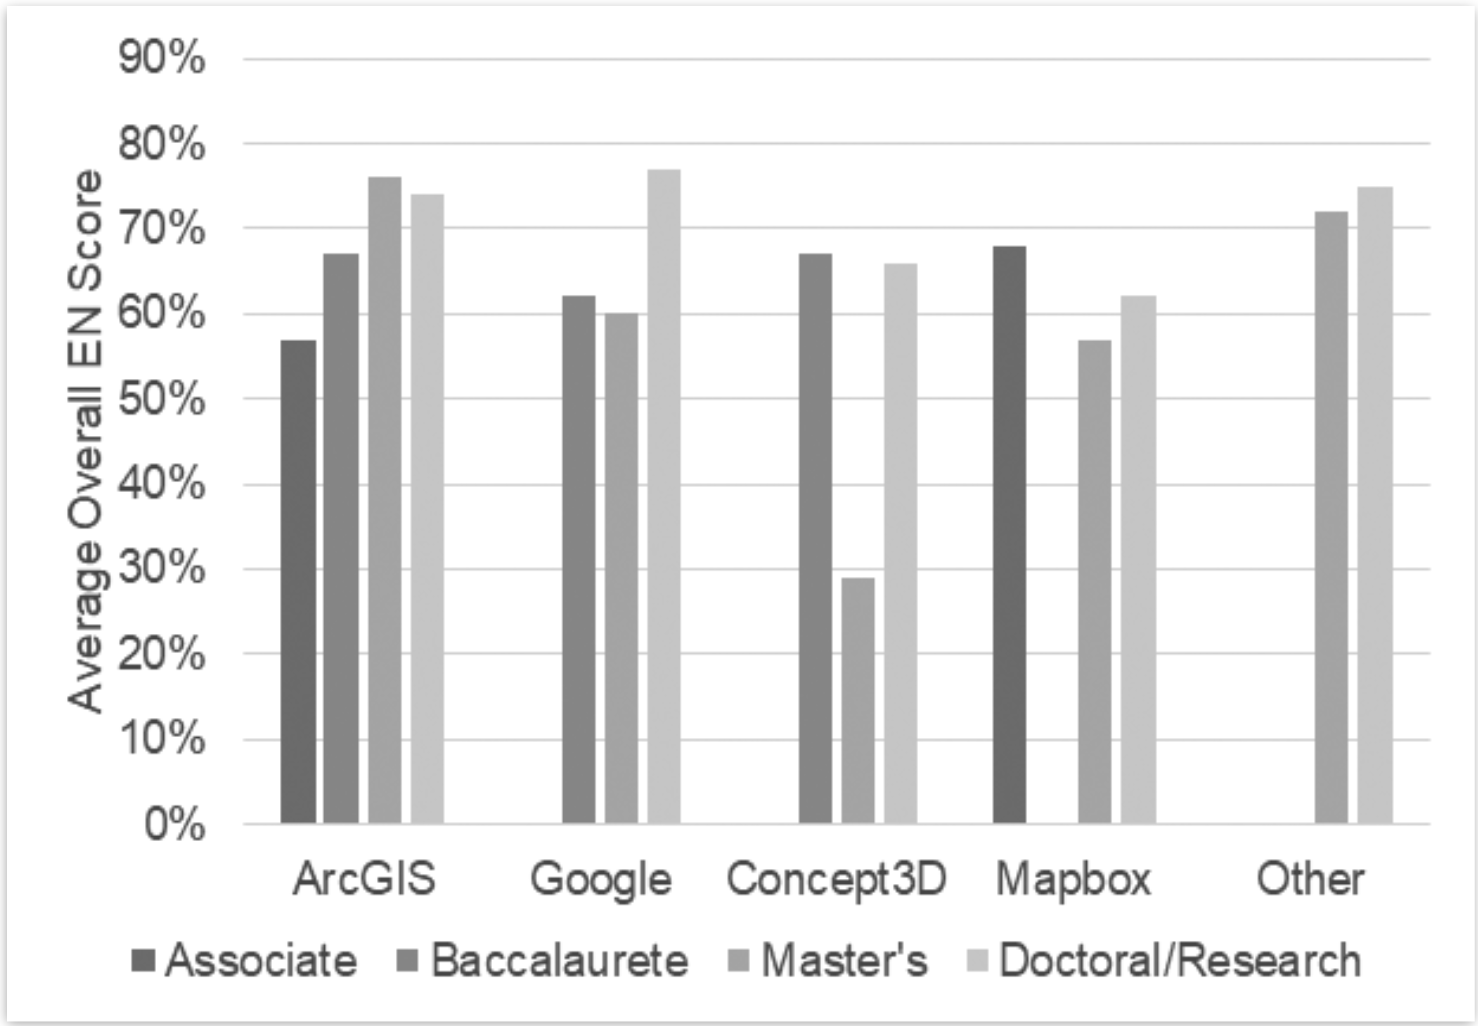
Figure 2: Summary of average overall EN Scores by GIS solution technology type.
Architecture of GIS Solutions
The analysis of each institution’s GIS solution determined that one of four digital architecture types were used within the GIS solution. Specifically, GIS solutions were composed of the following: layer(s), digital map(s), story map(s), or virtual reality. Digital maps, accounting for 55% of all institutions, were found to be the most prevalent DAT used in GIS solutions. Story maps, the second most common, accounted for 23% of DAT, while layers and a virtual reality accounted for 12% and 10% respectively. Figure 3 reveals that institutions deploying a digital map had a higher overall average EN score (i.e. 70%). Whereas, a layer DAT resulted in an overall average score of 65%, story map 62%, and virtual reality 61%.

Figure 3: Summary of average overall EN Scores by DAT
Conclusion
Stakeholder engagement and outreach, as measured by AASHE STARS, is positively impacted by a sustainability web presence. All types of institutional classifications featuring a sustainability webpage, as reported in STARS, demonstrate a higher average overall EN score as compared to peer institutions not reporting a specific webpage for sustainability. Institutions featuring a sustainability web page and a GIS solution are more likely to exhibit a higher overall average EN score when compared to peers only hosting a webpage. Institutions seeking to improve their stakeholder engagement and bolster their internal sustainability tracking capabilities could benefit from adapting GIS solution. Many institutions likely have students or employees with the skills and background to create a basic GIS solution. The workflow of creating a GIS solution could easily be integrated into existing courses or institutional clubs. The study suggests that institutions considering their first GIS solution could potentially benefit the most from deploying a digital map using ArcGIS. Whereas, institutions looking to upgrade an existing GIS solution could potentially benefit from a completely customized GIS solution.
In closing, the research in this study would greatly benefit from the availability and analysis of additional data points. Currently, STARS does not have a question explicitly asking if participants use a GIS solution in their sustainability efforts. Thus, a larger subset of the STARS population may use a GIS solution but omitted that information from their STARS reporting. Furthermore, usage metrics for webpages and GIS solutions are not reported in STARS and are not readily available for analysis. The absence of visitor information complicates a measurement of the efficacy of both modes of sustainability communication. Further investigations into this subject area are warranted to improve the precision of the data analysis and strengthening the suspected relationship between GIS and engagement.
Acknowledgements
This work was supported by staff at the University of Maryland, Baltimore County. Many thanks to all those working in the field of sustainability. R. Kmetz would like to include a special thanks to Sherilyn Smith, and the late David Smith, for their tutelage, mentorship, and friendship.
References
AASHE. (2019, June). STARS Technical Manual Version 2.2. https://stars.aashe.org/wp-content/uploads/2019/07/STARS-2.2-Technical-Manual.pdf
Cortese, A. (2003). The Role of Higher Education in Creating a Sustainable Future. Planning for Higher Education , 31, 15–22.
Duram, B. M. (2016). Applying AASHE STARS to Examine Geography’s “Sense of Place” in Sustainability Education. Journal of Sustainability Education, 11, 1–19.
Egiebor, E. E., & Foster, E. J. (2018). Students’ perceptions of their engagement using GIS-story maps. Journal of Geography, 118(2), 51–65. https://doi.org/10.1080/00221341.2018.1515975
Elwood, S. (2006). Critical issues in Participatory GIS: Deconstructions, reconstructions, and new research directions. Transactions in GIS, 10(5), 693–708. https://doi.org/10.1111/j.1467-9671.2006.01023.x
Gramatakos, A. L., & Lavau, S. (2019). Informal learning for sustainability in higher education institutions. International Journal of Sustainability in Higher Education, 20(2), 378–392. https://doi.org/10.1108/ijshe-10-2018-0177
Harder, C. (2016). The ArcGIS book: 10 big ideas about applying geography to your world. Esri Press.
Hwang, S. (2013). Placing GIS in sustainability education. Journal of Geography in Higher Education, 37(2), 276–291. https://doi.org/10.1080/03098265.2013.769090
Klinsky, S., Sieber, R., & Meredith, T. (2010). Connecting local to global: Geographic information systems and ecological footprints as tools for sustainability. The Professional Geographer, 62(1), 84–102. https://doi.org/10.1080/00330120903404892
Pickles, J. (1995). Ground truth: the social implications of geographic information systems. Guilford Press.
Stoughton, A. M., & Ludema, J. (2012). The driving forces of sustainability. Journal of Organizational Change Management , 25, 501–517.
Veland, S., Scoville-Simonds, M., Gram-Hanssen, I., Schorre, A. K., El Khoury, A., Nordbø, M. J., … Bjørkan, M. (2018). Narrative matters For Sustainability: The Transformative role of storytelling in realizing 1.5°C futures. Current Opinion in Environmental Sustainability, 31, 41–47. https://doi.org/10.1016/j.cosust.2017.12.005
What is GIS? (n.d.). https://www.esri.com/en-us/what-is-gis/overview.


 Mr. Ryan Kmetz holds a Masters in Environmental Studies – Sustainable Development and Climate Change. His interests as the Director of Sustainability at UMBC include how to document and advance sustainability across campus and society. His is extremely interested in the role of geospatial programs in engagement and education.
  Ms. Kayla Hickman is the former Environmental Sustainability Coordinator at the University of Maryland, Baltimore County. She assists UMBC in achieving its carbon neutrality goals through engaging faculty, staff, and students in programs and events centered around sustainable living and empowerment.