Abstract: Scientific literacy through critical-thinking and problem-solving is an important part of the future of our nation. Understanding of science and engineering concepts creates informed citizens who can contribute to democratic conversations and be knowledge consumers. Scientific literacy also requires an understanding of data and data analysis. This lesson uses Global Climate Change as a platform for understanding graphical data by exploring the manipulations of graphs and helping students recognize the ways in which perspective and scale play a role in graphing data. The lesson provided is designed to be covered in 90 minutes with high school students. Using four graphs of global temperature change, students will work in groups to analyze graphs and recognize the way in which scaling can play an integral role in the perception of information as well as an understanding of the degree of temperature change over periods of time due to global climate change.
Continue Reading
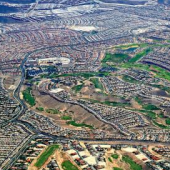
Like sprawl itself, writing about sprawl is scattered in a vast multidisciplinary literature. In this paper we provide a map of what is increasingly known about urban sprawl in emerging literature. This review of progress includes four main parts—definition, data, methods of measurement, and environmental consequences of urban sprawl. The focus of this literature review is to determine whether the aforementioned parts are elements of a connected system in which progress in any one part reflects in others, thereby enhancing knowledge of urban sprawl’s environmental consequences through a cross-fertilization with progress in how sprawl is defined, data are used, and phenomena are measured. We conclude with a discussion of areas of further research that surmounts the shortcomings of a disconnected, epistemic (knowledge) system of definitions, data, and methods, and points toward an explanation of urban sprawl’s environmental consequences. The implications for the education of urban sustainability are noted.
Continue Reading