


University Students and Sustainability. Part 1: Attitudes, Perceptions, and Habits

Rosentrater Burke JSE General Fall 2017 PDF
LINK: December 2017 General Issue: Curriculum and Change Table of Contents
Abstract
We undertook this study to understand the attitudes, perceptions, and habits of the student body at Iowa State University regarding the environment. We sought to understand their environmental knowledge and behaviors. Overall, we found that, regardless of demographic, students appear to be interested in environmental topics, reducing their footprint, and improving the environment overall, but they did not necessarily want to pay more, nor did they fully embrace personal responsibility.
Introduction
Many governments have instituted some degree of either climate mitigation or pollution reduction policies to address climate change. The United States and China, the two leading nations in global emissions, recently announced that both the U.S. and China would commit to substantial reductions in their greenhouse gas emissions by 2030 (Davenport, 2014). However, as Mike Hulme (date), contributor to the United Nations Intergovermental Panel on Climate Change (IPCC) writes in Why We Disagree About Climate Change, climate change is viewed as “mega-problem” that leads us to believe we need a “mega-solution,” and that kind of thinking has lead us astray (Hulme 2009). To effectively combat climate change, many solutions are must be enacted communally and locally, connecting to create vast social, cultural, and ecological change on a global scale.
Climate change is just one of many environmental issues in which humans play a causative role and are significantly impacted. Others include pollution, the increasing scarcity of water, and food insecurity – some of which can also be tied to climate change. It is true that many governments, companies, and NGOs are now working to address, mitigate, and even adapt to climate change.
Moreover, understanding of anthropogenic effects, discussions amongst citizens, governments, and companies, and programs to reduce human impacts on the environment are not only seen in the domain of policy makers and companies, but they are increasingly being infused into university activities and curricula as well. More than 21 million students were enrolled in U.S. institutions of higher education in 2013 (U.S. Department of Education, 2013). Many universities are taking steps to increase their efforts and not only become more sustainable themselves, but also to increase student knowledge about environmental impacts. Ohio State University, for example, has instituted a sustainability learning community that allows students to be actively involved in sustainability events across campus and to learn about sustainability with faculty members and partnering businesses (Ohio State University, 2014). The University of Maryland has an initiative termed “PALS”, or Partnership for Action Learning in Sustainability, which works with local government agencies to assist with implementing sustainability efforts (National Center for Smart Growth Research and Education, 2014).
Many of these efforts have been catalogued: the College Sustainability Report Card evaluated 322 schools in the U.S. in 2011, and determined that 75% of the participating schools had full-time staff dedicated to sustainability initiatives and education, over half of them have made commitments to achieving carbon neutrality, and 52% have on-site wind, solar, or geothermal energy production (College Sustainability Report Card, 2011).
However, how much do college and university efforts really impact student attitudes and behaviors? How much of the student population can be reached at each school? Some studies have attempted to answer these questions, and to determine how students perceive sustainability. For example, Richard and Adams (2011) compared views of campus sustainability by students at public universities in Alabama and Hawaii. Hawaii has been denoted as the fourth greenest state in the U.S., whereas Alabama the 48th; their study attempted to ascertain whether or not there was a link between the overall rank of the state and the perceptions of college students. Their study found that respondents from both states were concerned about waste and pollution, and were quite similar on their views about who is responsible for sustainability and the environment. However, a large proportion of students from Hawaii expressed willingness to participate in sustainable practices, whereas Alabama students were more reluctant (Richard and Adams, 2011). Other studies have found similar results. Overall, it appears that today’s students understand that there is a need for improved sustainability and waste control, and the need to reduce environmental impacts, but discrepancies arise regarding who should take responsibility for these actions, and how sustainable concepts should be implemented.
What about students in the Midwest? Iowa State University, the authors’ home institution, has also made commitments to improve its environmental footprint. This effort spans operations, research, education, and outreach. The Iowa Board of Regents (the governing board for the state universities in Iowa) has approved a sustainability plan for the university, which guides the university’s sustainability policies. Included in this plan, for example, is the requirement that all new buildings and major renovations must meet or exceed the U.S. Green Building Council’s guidelines for silver level LEED certification (Board of Regents, 2009). The university currently has six LEED-certified buildings with eight additional projects in progress. The combined energy portfolio of the university must include at least 10% from renewable sources. The university must also encourage recycling on campus, and will promote reuse, repurposing, and recycling of surplus items from laboratories, offices, and classrooms. The university has been reducing emissions in its campus vehicle fleet through the use of E85 and biodiesel fuels, and has been increasing the number of flux fuel, hybrid, and electric vehicles in the vehicle pool (Board of Regents, 2009). Recently, the university installed a 100-kW wind turbine, and it also purchases electricity from a wind farm, both of which produced ~9% of the university’s electricity in 2013 (Iowa State University Utility Services, 2014a). Just this past year, ISU installed solar panels for research and data collection on solar viability, and due to student motivation and innovation, brought multiple disciplines on campus together to collude in creating a campus-wide bike share program (ISU Relations office, 2016; ISU College of Engineering, 2015).
In addition, Iowa State University has developed an Energy Dashboard, which allows anyone with a web browser to see real-time energy use (and historic use) for any building on campus, as well as the university as a whole (Iowa State University Utility Services, 2014b). It depicts, both in real time and historical (weekly and yearly), the total amount of energy being used in most buildings on campus, and in doing so allows users to dynamically view the source of a building’s electricity, whether the source is provided by the Iowa State power plant, is purchased from the Ames power plant, or from the wind farm north of Ames.
As faculty on this campus who work in Environmental Studies and Sustainability issues, we wanted to know: do the students know about these efforts? Do these efforts toward reducing ISU’s environmental footprint filter down to the individual student as well? If so, how is the individual student impacted? How can the university provide more information about its sustainability efforts? What are the conservation practices of students? How could the university provide more information and training regarding environmental impacts? What additional practices would students like the university to implement so that the university could become even more sustainable, or help students live more “green” lives? Our study aimed to answer these questions.
Methods
After approval by the Iowa State University (ISU) Institutional Review Board, an online survey was emailed to all undergraduate (n = 28,893) and graduate students (n = 4,950) at ISU using the Qualtrics survey system. A questionnaire was developed which contained 43 close-ended and 35 open-ended questions, 78 questions total (see Appendix for the survey instrument which was distributed to the students). The close-ended questions were provided to obtain numerical data about the students and their perceptions, whereas the open-ended questions allowed them to elaborate on their answers. Broadly, the survey encompassed four main categories: 1) demographics; 2) personal attitudes, perceptions, and habits; 3) what they knew (or think they knew) about environmental issues; 4) what ISU could do to help them learn more about sustainability and to improve their personal environmental footprints.
At the outset, we fully understood that students receive many university-based and other emails and types of communications on a daily basis, so a priori our expectations for a high response rate were low. Our initial emailed request for participation was followed up with three reminder emails (one per week), so overall the survey was available for completion for a duration of four weeks. As expected, the response rate was fairly low. We recognize that this is a limitation of the study, and it may be difficult to generalize for all students at this university, but we must emphasize that, at least in this exploratory phase of our research, our results were quite revealing. Lessons learned from this study will help us develop a more targeted survey in the future.
A total of 1,226 students completed (or substantially completed) the survey instrument, which equated to an effective response rate of approximately 3.5% of all ISU students. Of those respondents, 848 students were enrolled as undergraduates, while 298 were graduate students. Of the total respondents, 521 were male (45%), and 624 (54%) were female.
All numerical results were statistically analyzed using Microsoft Excel, whereas the open-ended questions were summarized according to theme. The first two portions of our survey will be discussed in this paper; the other two segments are the subject of another article currently under development (Rosentrater and Burke). A third article analyzing student responses to questions that asked them to reflect on their personal contributions to environmental damage and any actions they take to mitigate those impacts is forthcoming from Climate Change: Impacts and Responses (Burke and Rosentrater, 2017).
Results and Discussion
1) Demographics
Looking at an overview of the students who responded to the survey (Figure 1) is quite enlightening. Out of the 1126 respondents, 1134 majors were reported (due to double majoring by a handful of the students). The colleges with the highest responses were Agriculture and Life Sciences, and Engineering. Liberal Arts and Sciences also had a fairly large response to the survey. Chemical and Mechanical Engineering individually were the highest reporting majors. In fact, Mechanical Engineering is the largest major at ISU by student population, while Chemical Engineering is also one of the largest majors within the College of Engineering. Further, it should be noted that there were several majors that had some relationship with environmental issues (e.g., Agronomy, Biology, and Environmental Science all had high rates of response). Perhaps this was due, at least in part, to inherent interest that students in these majors may have had in the issues covered by this survey. Additionally, 396 minors were reported for the 1126 respondents (35% of respondents). The highest reported minors were Agronomy, Spanish, and Sustainability – which again, may explain participating in the survey.
When this survey was administered, males comprised 56% of the ISU population whereas females accounted for 44% of the overall student population (Iowa State University Office of the Registrar, 2014a). The university-wide male-to-female ratio was inverted, however, vis-à-vis respondents to our survey. The higher level of female respondents may, in fact, impact our survey results – in favor of belief that climate change is being caused by humans. This trend can also be seen in recent polls that found approximately 60% of U.S. women believe that climate change is human-caused compared to only ~40% of U.S. men (Saad, 2014). At the time of survey distribution, graduate students made up only 14.6% while undergraduates accounted for 85.4% of the overall student population (Iowa State University Office of the Registrar, 2014b). Because this survey had a much higher graduate student representation compared to their actual proportion of the student body, the survey results may be impacted due to graduate students possessing knowledge acquired elsewhere or through additional experience. We had no way to gauge these impacts, however.
At the time of the survey, 21.5% of ISU students lived in campus residence halls (Iowa State University Department of Residence, 2014). This level was almost exactly the same percentage (21%) of respondents who indicated that they lived in residence halls in the survey. Additionally, 56% of respondents reported that they lived in apartments (either within the Department of Residence or external to the university), while 22% of respondents indicated that they lived off campus but not in an apartment (which was most likely in a house or other arrangement).
In 2014 Iowa residents comprised 58.8% of all students at ISU, whereas non-Iowa students from the United States made up 29.6% of students, and international students were 11.6% of the student population (Iowa State University Office of the Registrar, 2014a). The respondents to this survey mirrored this distribution: 56% of respondents were from Iowa; 36% of respondents were from the U.S. but from outside Iowa; 8% were from outside the U.S.
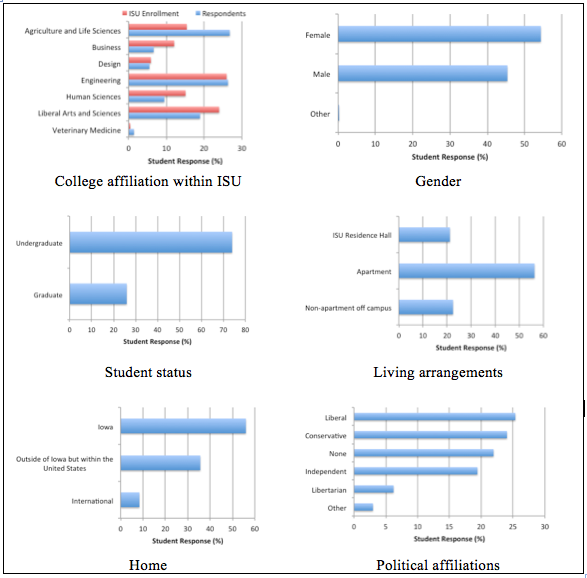
Figure 1. Demographics of survey respondents.
Shortly after the close of the online survey, the March 6, 2015, Gallup poll on political party affiliation indicated that 27% of their respondents identified themselves as Republican, 28% identified as Democrat, while 44% identified as Independent (Gallup, 2015). Respondents to our survey were somewhat similar to that reported by Gallup: 24% Republican vs. 25% Democrat. The rest of our responses were somewhat different from the Gallup results; 19% identified as Independent, 6% as Libertarian, 3% as Other, and 22% as None. Our results were likely more diverse because we included Libertarian, Other, and None as categories, whereas the Gallup poll did not. Thus, fewer of our respondents identified as Independent, but over one-fifth of them indicated that they did not identify with any particular political affiliation.
2) Attitudes, Perceptions, and Habits
A large portion of our survey (20 questions) centered on attitudes, perceptions, and habits of the students. Some of their numerical responses are summarized in Figure 2. As shown, 42% of the 1126 students indicated that they believed that climate change was happening; 2% of all respondents did not believe in climate change; 56% of students did not answer this question. We speculate that perhaps the majority were unsure and so chose not to answer the question. Therefore, considering those who did respond, the majority (95.2%) did believe that climate change was real, while only 4.8% did not. A recent study by the Pew Research Center indicated that approximately 61% of Americans believe that the climate is changing, and that percent is relatively stable across generations (Motel, 2014). Why did our student body respond at a higher level? Hopefully it is because they are learning about these issues in school, perhaps in high school and/or at ISU. And, if the majority students understand that the climate is changing and that it has an impact on their lives, hopefully they will be more likely to change their own personal behaviors.
What did the students think was causing the climate to change? As shown in Figure 2, 45% of the students responded that humans were responsible; 35% that natural processes were responsible; 77% that it was a combination; 2% that climate change was not actually happening.
The students obtained their information about the environment and climate change from a variety of sources. In fact, no single source dominated. As shown in Figure 2, traditional news media, Internet sites, classes, and family/friends were the primary sources of information for the students. Ironically, both “my own opinion/experience” and government reports were chosen by 30% of the students. Apart from traditional television news, other news sources that were frequently listed included the New York Times, National Geographic, and the Huffington Post. Additionally, both the Daily Show with Jon Stewart and the Colbert Report were listed multiple times. There were a wide variety of responses listed for those who selected Internet sources. These included NASA, EPA, USDA, and NOAA/NWS in terms of government agencies. Other sources included 350.org and TED talks. A number of respondents also indicated they read scientific literature on the issue and some had even done their own research on the topic. Social media was not listed as one of the top sources for environmental information. However, the high number of respondents who indicated that they received some information from their friends and family means that these issues are being discussed by about one-third of the respondents.
Students were then asked if they thought that conservation was important. Nearly every student who answered this question responded that they believed that conservation was important. Some indicated that conservation should be economically viable and not hurt the people it’s trying to protect. It is true that this was a broad question, but the general consensus was that it is important, and the students seemed to realize that efforts must be undertaken in order to ensure that future generations are not harmed.
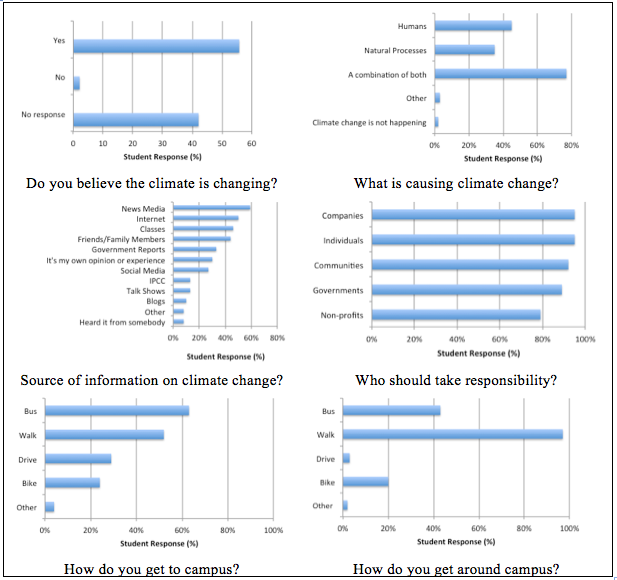
Figure 2. Overall student attitudes, perceptions, and habits.
We then asked a series of questions regarding responsibility and actions to improve the environment. When asked if they had a personal role in contributing to climate change, or if it was the university’s role to adjust its actions, 461 respondents indicated that they believed it should be a combination between personal action and action taken by the university, 70 indicated that they believed only a personal role should be taken, and 47 indicated that they believed only the university should take action. Verbatim sample responses (including spelling errors) are provided in Table 1. Some respondents expressed concern that the university could do more to encourage sustainable practices, such as providing more recycling and composting opportunities, and that it has a responsibility to provide those services to the student body. Many responses suggested that the university’s responsibility should be to provide services for students but it is the students’ responsibility to use those services. Students indicated that they felt that the university has the ability to take actions on a broader level, which will have an overarching effect on the university community as a whole. Individuals do not have that ability and therefore cannot effect as wide ranging of an impact on the university community. Still, many recognized that they have a responsibility to adjust their individual actions.
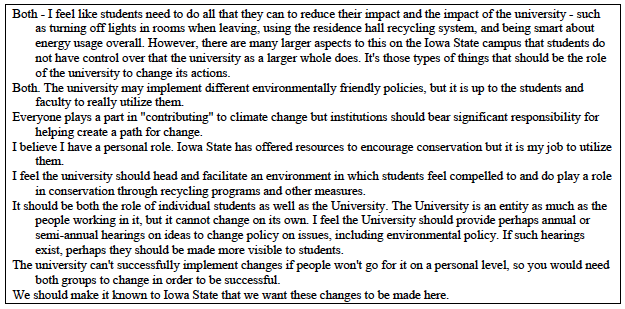
Table 1. Sample responses for personal role vs. university role.
More broadly, who should take responsibility for making changes to combat climate change? All respondents strongly felt that individuals, companies, and communities (>92%), but also governments (89%), and non-profit corporations (79%), bear this responsibility (Figure 2). The respondents clearly understood that the major contributors to climate change (companies and individuals), and governments and communities (who set and implement policies and regulations), all must work together.
In terms of what each individual can do to combat climate change, a wide variety of responses were given (Table 2 provides a sample of student responses). Out of 652 responses, several common themes arose organically. A number of respondents suggested voting for politicians who support for clean energy programs and “green” policy. Others suggested buying only products that are produced sustainably and from companies who are environmentally friendly. Many respondents said that each person should change their lifestyles and become more conscientious about how personal decisions affect the environment. Several suggested carpooling as a way to reduce one’s carbon footprint, while many others suggested that individuals should drive less, take public transportation, or buy more fuel efficient cars. Several mentioned adjusting their diets as a way to be more sustainable, in addition to eating local foods, eating less meat, and eating less processed foods. Several responses mentioned the fact that it is the small, every-day decisions they make that have the largest impacts on the environment and are the easiest to change to reduce that impact. Several respondents listed making houses more energy efficient and adjusting the thermostat to reduce energy consumption. Many respondents also mentioned using reusable bags for groceries instead of using plastic bags. The largest response, 223 out of the 652 respondents (34%), listed recycling as a way for individuals to impact the environment. As one respondent said, we need to stop the “buy and throw away culture.” Unfortunately, this is far easier said than done in our country.

Table 2. Sample responses for what individuals can do to combat climate change.
When asked what companies can do to combat the effects of climate change, 628 students answered this question. Respondents strongly believed that companies have a responsibility to reduce their carbon footprint and overall environmental impact. As can be seen in some sample responses (Table 3), comments ranged from reducing water and energy use within facilities, to reducing the amount of packaging on products, and correctly labeling products as “green.” Many responses asserted that companies should focus on their environmental impact, and that more emphasis should be placed on long-term sustainability rather than on short-term profits.
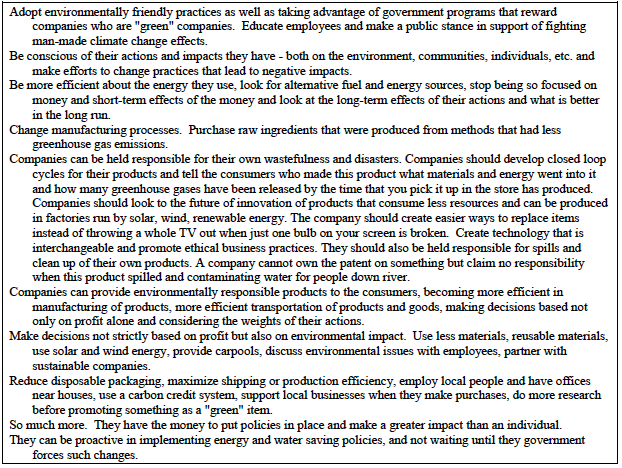
Table 3. Sample responses for what companies can do to combat climate change.
When asked what governments can do to combat the effects of climate change, 617 students responded. Most of the responses to this question mentioned that governments should be taking actions both nationally and globally (Table 4). Nations have the broach reach that individuals and companies don’t have, and can potentially make the most impactful decisions. Many of the suggestions given by respondents involved reducing use of fossil fuels and funding new energy sources, such as solar, wind, geothermal, and nuclear power, which could supply cleaner sources of electricity. Additionally, they also mentioned that governments should more strictly enforce environmental protection laws and impose stronger fines on companies who violate those laws. Another topic discussed several times was the creation of a carbon tax or cap-and-trade system, because the respondents thought that creating this system could help bring down overall emissions and increase revenue to the government to fund environmentally-focused projects.
When asked what non-profits and communities can do to combat the effects of climate change, 567 students responded. Many students focused on their personal and communal roles (Table 5). Comments included setting up recycling programs, encouraging the use of energy efficiency appliances, and pushing for the creation of public transportation systems (including bike lanes, carpooling groups, and other forms of reducing individual car-based transportation). Implementing many small changes throughout many communities can have large overall impacts on the environment. By promoting environmentally sustainable lifestyles, communities and non-profits can contribute to revitalizing a cleaner environment due to their connection to large numbers of individuals and their ability to advocate for and implement change among many.
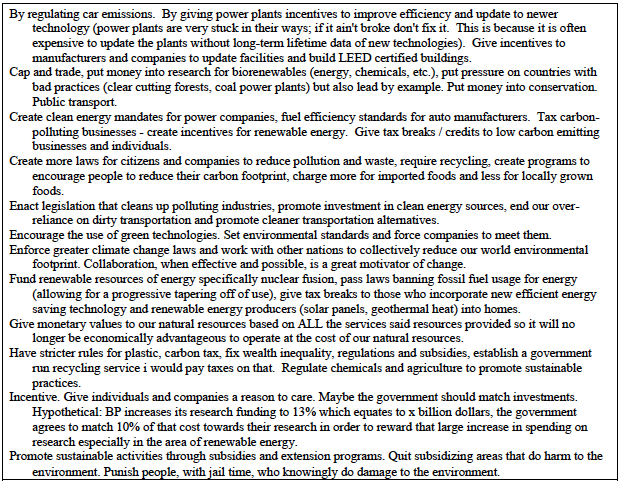
Table 4. Sample responses for what governments can do to combat climate change.
When asked what can be done on a global scale to alleviate the effects of climate change, 550 students responded. It appeared that most students realized that in order for emission reductions to be effective, they must be done on a worldwide scale (Table 6). Many discussed that implementing changes in individual countries can be a good start, but the most effective and realistic option for any real reduction in emissions of greenhouse gases is worldwide agreement. The students agreed that this is especially needed in countries like the United States, China, and India, who are the world’s largest polluters, but have yet to take substantial steps to reduce their carbon dioxide emissions. Respondents also realized that there needs to be clear communication and collaboration between countries in order to facilitate these efforts. Furthermore, the students understood that industrialized nations need to lead and set examples for the developing world by making substantive cuts to their own carbon dioxide emissions.
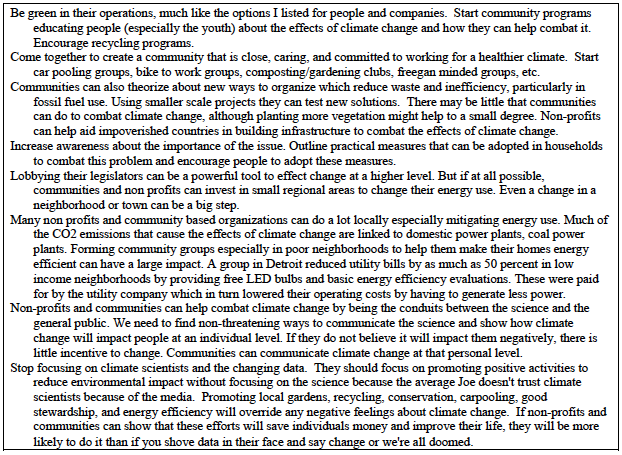
Table 5. Sample responses for what community and non-profit groups can do to combat climate change.
When asked what they thought about the role that science, technology, and engineering play in mitigating the impacts of climate change, 571 students responded. (Sample responses are provided in Table 7.) Overall, responses to this question reiterated the need to create new technologies and new sources of clean energy. Students seemed to understand that informed decisions can only be made if data has been collected and used to direct policies. In addition, they recognized that green technologies could play a role in reducing carbon emissions.
When asked if the humanities and arts play a role in mitigating the impacts of climate change, 559 students responded. Only 20 said “no”. Overall, respondents thought that the arts and humanities play a very important role, although it is different from that of science, technology, and engineering. (Sample responses provided in Table 8.) Students felt these disciplines fill a communication gap and should help effectively communicate the research from science and

Table 6. Sample responses for what can be done on a global scale to combat climate change.
engineering to the common person. Further, students noted that the arts and humanities can show how normalized behavior contributes to the climate crisis, and could provide a shift in public thinking and perception of these issues. Music, art, television, and media function in a social and cultural realm, and so can reach people who may not otherwise understand or be willing to listen. And, students felt that these disciplines could allow more outreach to people within their homes and personal lives, and affect them in ways that scientific research doesn’t. Through creating more personal connections to citizens, the arts and humanities can facilitate more affective interactions with environmental issues, leading people to feel an intimacy, an urgency, and a responsibility to adjust their actions.

Table 7. Sample responses for role of science, technology, and engineering fields.
When asked what might encourage them to be personally accountable for their own actions, 556 students responded. (Some of the responses to this question are provided in Table 9.) Ironically, several respondents stated that technology that would remind them of, or show them, their daily impact might encourage them to be more accountable for their actions. For example, an app that indicated how much carbon they emitted each day based on their activities, and which offered a perceived or virtual reward when they reached a specified goal for recycling or walking instead of driving, could potentially help them make more sustainable choices. Respondents were somewhat split between wanting to be rewarded for their actions, and simply being aware of what consequences their actions had and then acting accordingly to reduce that impact. It should be noted that education and awareness about actions and impacts aren’t always effective as motivations in themselves, which can be true even if people see a direct personal benefit. Personal accountability is further explored in Burke and Rosentrater (2017).
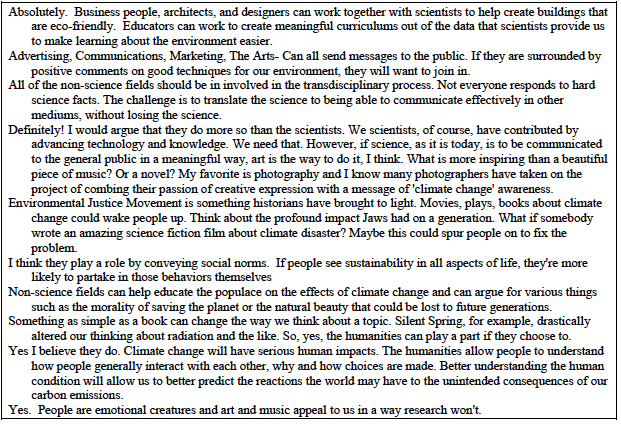
Table 8. Sample responses for role of non-science fields.
In terms of getting to campus each day (Figure 2; 763 respondents), 24% arrived by biking, 52% by walking, 29% by driving, 63% by bus, and 4% other. Since the majority of students either live on or near campus, walking, biking, and riding the citywide bus system were the most convenient forms of transport. Even though there is limited parking available to students on campus, almost 1/3 of students drove to campus. Why did respondents (705) choose the option they did? Primarily cost and convenience were the overriding factors, not environmental choice or a desire to be more environmentally conscious, and these findings apply to how students get around on campus as well.
When asked how they navigate campus (762 respondents), almost all do so by walking (739; Figure 2), while slightly less than half (330) use the university bus system. Almost 20% (151) used a bicycle for transport on campus. Once again, the overarching factor when deciding how to get around campus was convenience. Most students walk because it is the easiest option available to them, not because it is a healthier choice or a more environmentally friendly choice.
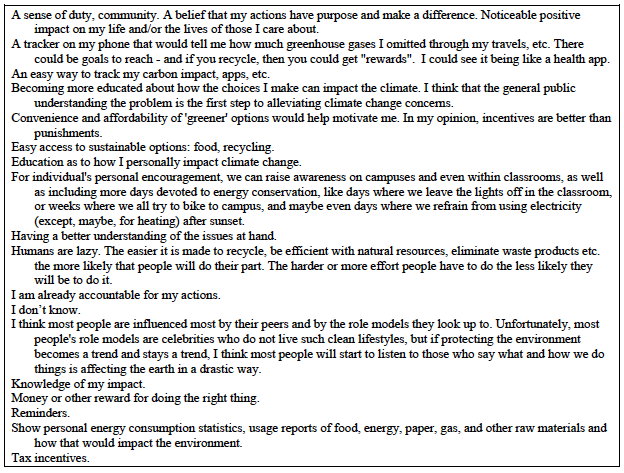
Table 9. Sample responses for what might encourage people to be personally accountable.
Conclusions
From our survey of students, all indications are that ISU students have a fairly high comprehension of major issues related to human impacts on the environment and to climate change. They do not, however, fully embrace personal actions to lower their impact on the environment. Some of this may be related to their acceptance of personal responsibility; some may also be due to their perception that the university could do more to facilitate these actions.
One of the key messages from the survey was that the student respondents were very interested in having ISU obtain more of the campus’ energy supply from renewable sources. For example, students were quite interested in wind and solar as potential energy sources for the university. Not only could these alternative energy sources reduce the campus carbon footprint, but they could also offer new opportunities for teaching and public outreach.
Furthermore, students were very interested in increasing campus-wide recycling efforts, adding composting capabilities, and expanding public transportation. Specifically, they felt that the availability of recycling containers and encouragement to recycle could be increased throughout the university, and by “recycling” they meant the recycling of trash as well as composting of food and other organic wastes. Ironically, many students were actually aware of the quantity of waste that they were producing, and they did want options for lowering their environmental footprint (other than reducing their own consumption, that is).
It appears that students have a strong desire for ISU to play a bigger role in not only improving campus environmental performance, but also to increasing educational efforts related to sustainability. Students want to learn more about what they can do on a personal level to care for the environment and promote good stewardship. As with society at large, however, they don’t necessarily want to pay more money to successfully achieve these efforts. By and large, Iowa State University students are aware of sustainability issues, but more efforts are needed, both on a personal as well as a campus level.
References
Board of Regents. 2009. Campus Sustainability – Part II: A Board of Regents Initiative. http://www.regents.iowa.gov/Meetings/DocketMemos/09Memos/March/0309_ITEM15.pdf.
Burke, B. and K. A. Rosentrater. 2017. Accountability: the missing link in environmental education. Climate Change: Impacts and Responses (submitted, in review).
College Sustainability Report Card. 2011. Executive summary: key findings. http://www.greenreportcard.org/report-card-2011/executive-summary/key-findings.html.
Davenport, C. 2014. Deal on carbon emissions by Obama and Xi Jinping raises hopes for upcoming Paris climate talks. New York Times. http://www.nytimes.com/2014/11/13/world/asia/deal-on-carbon-emissions-by-obama-and-xi-jinping-raises-hopes-for-upcoming-paris-climate-talks.html?_r=0. November 12, 2014.
Gallup. March 6, 2015. Party affiliation. http://www.gallup.com/poll/15370/party-affiliation.aspx.
Hulme, Mike. 2009. Why We Disagree About Climate Change: Understanding Controversy, Inaction, and Opportunity. Cambridge: Cambridge University Press.
Iowa State University Public Relations Office. 2015. Solar Panels to Join the Grid.
http://www.inside.iastate.edu/index.php/article/2015/08/13/solar
Iowa State University College of Engineering. 2015. University Students Build Their Own Bike Share. https://news.engineering.iastate.edu/2015/11/11/university-students-build-their-own-bike-share/
Iowa State University Department of Residence. 2014. Capacity and occupancy. Iowa State University. http://housing.iastate.edu/data/occupancy.
Iowa State University Office of the Registrar. 2014a. Gender, ethnicity and residence reports. Iowa State University. http://www.registrar.iastate.edu/enrollment/gender.
Iowa State University Office of the Registrar. 2014b. enrollment by major or department. Iowa State University. http://www.registrar.iastate.edu/enrollment/enrollment-by-major.
Iowa State University Utility Services. 2014a. Environmental Performance. Iowa State University. http://www.fpm.iastate.edu/utilities/environmental_performance.asp.
Iowa State University Utility Services. 2014b. Energy Dashboard. Iowa State University. http://www.fpm.iastate.edu/utilities/energy_dashboard/default.asp
Motel, S. 2014. Polls show most Americans believe in climate change, but give it low priority. Pew Research Center. September 23, 2014. http://www.pewresearch.org/fact-tank/2014/09/23/most-americans-believe-in-climate-change-but-give-it-low-priority/.
National Center for Smart Growth Research and Education. 2014. University of Maryland. Partnership for Action Learning in Sustainability.
Ohio State University. 2014. Office of student life: university housing. SUSTAINS Learning Community.
https://housing.osu.edu/learningcommunities/sustains-learning-community/
Richard E. and J.N. Adams. 2011. College students’ perceptions of campus sustainability. International Journal of Sustainability in Higher Education. Vol. 12, Iss. 1 pp. 79 – 92.
Rosentrater, K. A. and B. R. Burke. 2017. Survey of university students and sustainability. Part 2. What students think they know about environmental issues, and how universities can improve their education. (in preparation).
Saad, L. April 22, 2014. One in four in U.S. are solidly skeptical of global warming. Gallup. http://www.gallup.com/poll/168620/one-four-solidly-skeptical-global-warming.aspx.
U.S. Department of Education. 2013. Digest of Education Statistics, 2012 (NCES 2014-015), Chapter 3. National Center for Education Statistics.


 Kurt A. Rosentrater is an Associate Professor in the Department of Agricultural and Biosystems Engineering at Iowa State University, Ames, Iowa, USA. He is a process engineer, and has research and teaching interests in storage, handling, preservation, and processing of foods, cereal grains, and biomaterials. Additionally, he works in life cycle assessments, sustainability assessments, and efficiency assessments, and applies these tools to improve supply chains of food and biological materials. Contact: karosent@iastate.edu
  Brianna R. Burke is an Assistant Professor in the Department of English at Iowa State University, Ames, Iowa, USA. She is an environmental humanist, and has research and teaching interests in environmental justice (both American and Trans-national), climate change and literature, ecocriticism, ecofeminism, post/trans-humanism, American Indian literature, race and 20th Century American literature. Contact: brburke@iastate.edu