


Sustainability Knowledge Assessment at a Large, Regional, Minority-Serving Institution

Lundquist Dec 2018 General Issue PDF
Lundquist JSE Dec 2018 General Appendix PDF
Abstract: To assess the sustainability literacy of students at California State University, Northridge (CSUN), we administered a modified version of the Assessment of Sustainability Knowledge (ASK) to 2,993 students in 60 courses over 5 semesters. CSUN is a large minority-serving institution with a regional focus. Within the general student population, students gain about 2.7 percentage points each year as they progress from freshman to senior year. For each sustainability-related course they take (up to 3), they also gain an average of 2.7 percentage points. Within our core sustainability courses, students gain an average of 11.6 percentage points from pre-test to post-test. Students enter CSUN with a statistically significant gender gap in sustainability knowledge with males having average scores 7.6 percentage points higher than females, but the gender gap closes completely by completion of coursework in a sustainability minor program. Our students enter college with less sustainability knowledge than those in two other more selective institutions who conducted similar surveys (Ohio State University and Wartburg College) but gain knowledge at a similar rate. We also find that students with more prior sustainability knowledge self-select into sustainability courses and that students from different majors improve sustainability knowledge at different rates when taking related courses.
Keywords: Sustainability literacy, knowledge assessment, gender gap, minority-serving university
Just as sustainability requires knowing the environmental, social, and economic needs and resources within a community, sustainability education begins with knowing the educational needs and resources of the students. The Association for the Advancement of Sustainability in Higher Education (AASHE) Sustainability Tracking, Assessment & Rating System (STARS) rating system formalizes this principle by giving credit to universities that assess sustainability literacy. However, only a small portion of STARS schools have pursued campus-wide sustainability assessments, and few of them are minority-serving institutions. When sorting STARS Gold and Platinum awardees by ethnic diversity, only five out of the 15 most diverse schools have embarked on any sort of sustainability assessment, and only one school has received full credit for their assessment. Environmental justice advocates have long been aware that predominantly minority communities bear a significantly greater burden of environmental hazards than predominantly white communities (Brown, 1995; Brulle & Pellow, 2006; Szasz & Meuser, 1997). It is therefore important to develop a strong understanding of how sustainability knowledge differs between universities serving different student populations.
The literature shows differing backgrounds and upbringing affects sustainability knowledge. For example, O’Brien (2007)documented specific correlations between students’ early upbringing and their level of environmental literacy. She found that students who report spending time doing more outdoor activities in their childhood score higher on a knowledge assessment as university students. Any factor that affects a person’s opportunity for outdoor engagement early in life could therefore influence their knowledge and attitudes towards sustainability including gender (boys and girls play differently), ethnicity (different cultures have different views on outdoor play), geography (urban and rural children have different access to natural settings). In fact, there are documented differences in the environmental literacy of each of these groups. Rural students scored higher than urban students on knowledge assessments in both Iowa and Finland (O’Brien, 2007; Tikka, Kuitunen, & Tynys, 2000). Some researchers have found that people from minority ethnicities have less engagement with sustainability issues (Johnson et al., 2004; Morrone et al., 2001; Zimmermann, 1996), though others have argued that this gap is only prevalent at low income and educational levels; there may be little difference between ethnicities when controlling for education level (Caron, 1989). Thus far, much of the pioneering work in sustainability literacy has been conducted on campuses with comparatively low minority populations. In this paper, we characterize the sustainability knowledge at our institution, a minority-serving university, and compare our findings to those of schools with different demographics.
Another issue of knowledge equity is what the National Report Card on Environmental Knowledge, Attitudes and Behaviors refers to as an “Environmental Gender Gap,” with men consistently answering knowledge questions correctly more often than women (National Environmental Education and Training Foundation, 1998). The effect is often small but statistically significant, with men scoring 3.8 percentage points higher on tests at universities in Finland (Tikka et al., 2000), 5.4% at Iowa State University (O’Brien, 2007), and 9%-12.5% during different years of the National Report Card (Coyle, 2005; National Environmental Education and Training Foundation, 1998). While the assessment instruments differ, the pattern is consistent. Gendall and Smith (1995)show that the effect is almost universal across six different countries, though they note that the effect is much smaller than other factors such as education level. What can universities do to address this gap?
In this paper, we report our findings from a campus-wide sustainability knowledge assessment. In particular, we pursue the following research questions:
- How does our students’ sustainability knowledge compare to other campuses? Are there observable “achievement gaps” in sustainability knowledge between minority serving institutions and non-minority serving institutions?
- Does students’ prior knowledge of sustainability correlate with their choice to take sustainability coursework?
- How much does sustainability knowledge change among different populations of students, including different majors, different genders, and students that elect to take sustainability courses versus those that do not?
Sustainability Knowledge Assessments
The desire to assess sustainability knowledge grows out of a general assumption that knowledge is one of the key ingredients to behavior change. A study done by the National Environmental Education and Training Foundation found that environmentally knowledgeable people were 50% more likely to recycle, 50% more likely to avoid using chemicals in yard care, and 10% more likely to save energy in the home (Coyle, 2005). Coyle also describes a detailed assessment of environmental literacy, but sustainability literacy goes beyond that to include economic and social sustainability (United Nations, 2005, p. 12; Zwickle, Koontz, Slagle, & Bruskotter, 2014). Driven in part by the AASHE STARS program (AASHE, 2017), a number of institutions have embarked on campus-wide efforts to characterize this full breadth of sustainability knowledge. Barnes (2014)shows that the vast majority of schools survey for attitudes and values of sustainability and not knowledge. There have, however, been several efforts to develop standardized assessment tools. The University of Maryland piloted an assessment with 15 multiple choice items to assess learning outcomes from their Climate Action Group (Horvath, Stewart, & Shea, 2013). Around the same time, James Madison University independently developed a 50 item assessment aligned with their learning outcomes (Hartman, DeMars, Griscom, & Butner, 2017). The Ohio State University’s Environmental and Social Sustainability Lab developed an assessment tool to measure sustainability knowledge in the three domains of environmental, economic, and social sustainability. An initial 30 questions were established and given as a survey to 2,000 OSU undergraduates in 2012. Using Item Response Theory (IRT), the questions were analyzed and the question set was reduced to 16 questions (Zwickle, Koontz, Slagle, et al., 2014). Ohio State then partnered with the University of Maryland in 2013 and tested another 3,000 students. From there, the question set was expanded to 28 questions. This survey is now known as the Assessment of Sustainability Knowledge (ASK; Zwickle, Koontz, Bodine, Slagle, & McCreery, 2014). A number of institutions have used items from ASK for their AASHE STARS submissions including Keene State, University of Alberta, University of Wisconsin-La Crosse, and Wartburg College.
Institutional Context
California State University Northridge (CSUN) is a large minority-serving public university in urban southern California. As part of the California State University system, CSUN draws students primarily from the designated local region of the San Fernando Valley area of Los Angeles. The Valley’s 1.8 million residents are 46% Hispanic, and CSUN’s student demographics accurately represent this local population (Table1). As such, it has received federal designations as a Hispanic Serving Institution (HSI) and an Asian American, Native American, Pacific Islander Serving Institution (AANAPISI).
CSUN established an Institute for Sustainability in 2009 to lead the campus’ efforts in sustainability planning and education, campus-wide sustainability-related actions, community engagement, and research. One of the Institute’s first successes was to coordinate the development of sustainability-related course offerings available to undergraduate students. In particular, the campus added three core courses and a minor in sustainability in 2011 and a sustainability-themed “general education pathway” in 2012, which is a curation of thematic coursework satisfying general education requirements. The Institute for Sustainability developed CSUN’s Sustainability Plan in 2012 which provided a roadmap for campus improvements. In 2016 the campus participated in the AASHE STARS program for the first time, as a way to recognize its progress and received a Gold rating. CSUN’s submission included a campus-wide assessment of sustainability literacy which grew out of its ongoing assessment of undergraduate sustainability coursework beginning in 2013. Because CSUN is so regionally-focused at the undergraduate level, the campus-wide sustainability literacy reflects both efforts at the University itself and the general state of the local community that it serves.
Table1. Demographics of undergraduate students at CSUN, 2016
| Total Students | 37,188 |
| American Indian or Alaska Native | <1% |
| Asian | 11% |
| Black or African American | 5% |
| Hispanic | 44% |
| Native Hawaiian or Other Pacific Islander | <1% |
| White | 23% |
| Two or more races | 3% |
| Race/ethnicity unknown | 5% |
| Nonresident alien | 9% |
| Male | 46% |
| Female | 54% |
| Come from families with AGI < $10,400 | 18% |
| Pell grant recipients | 53% |
Sources: https://nces.ed.gov/ipeds/datacenter/login.aspx?gotoReportId=1; CSUN Institutional Research
Design
We administered a knowledge assessment with 25 questions that cover the 3 domains of sustainability: economy, environment, and social. Fourteen of the questions came from the original assessment survey tool developed by The Ohio State University’s Environmental and Social Sustainability Lab, and another 4 questions were added from the combined OSU/University of Maryland ASK survey (Zwickle, Koontz, Slagle, et al., 2014). An additional 7 questions generated by CSUN faculty were added pertaining specifically to California and to the university’s sustainability program (Appendix 1). We also asked questions regarding gender, year in school, college of major, and number of sustainability-related courses taken.
To determine the sustainability literacy levels of the general student population, faculty from seven departments volunteered to administer the survey in class in general education courses (Anthropology, Biology, Environmental & Occupational Health, Geography, Health Sciences, Political Science, and Religious Studies). This convenience sample provided us access to the full cross section of the student body because students were taking the courses to fulfill the university’s breadth requirement. Participating students completed the assessment just once during the semester. We list this test as a ‘pre-test’ even though there is no corresponding post-test for these students.
We also administered the assessment in the three required courses for the sustainability minor, SUST 300 (Interdisciplinary Perspectives in Sustainability; http://catalog.csun.edu/academics/lrs/courses/sust-300/), SUST 310 (Best Practices in Sustainability; http://catalog.csun.edu/academics/lrs/courses/sust-310/), and SUST 401 (Applied Sustainability; http://catalog.csun.edu/academics/lrs/courses/sust-401/). SUST 401 is a project-based capstone for sustainability minors that requires both 300 and 310 as prerequisites. SUST 300 and 310, however, also meet a portion of university’s general education requirement and therefore attract a range of students beyond just sustainability minors. We surveyed the three SUST courses both at the beginning and the end of the semester. To complete the sustainability minor, students must also complete an additional three courses with connections to sustainability that are offered from different departments on campus. While these courses were not a focus of our study, faculty volunteered to administer the assessment in four of these courses.
A total of 60 classes and 2,993 students were sampled from the Fall of 2013 through the Spring of 2016. Thirty of those classes were core sustainability courses (pre- and post-tests), four were supporting courses from the sustainability minor (pre-test only), and 26 were non-sustainability courses (pre-test only). 1,994 non-sustainability students and 999 sustainability students participated in the survey. 756 sustainability students completed both the pre- and post-tests. Graded pre-tests were not returned to students, thus students did not have an opportunity to study answers in preparation for the post-test. In addition, surveys were all collected after all test administrations and were not available online. This prevented their circulation amongst students. Post-test scores were not an element of students’ grades.
Data were compiled and analyzed using statistical packages in Octave, an open-source computational package. T-tests and one-way ANOVA tests were performed to compare means between different groups in order to understand how sustainability knowledge varies across gender, school year, discipline, and number of sustainability courses taken.
Findings and Discussion
Table2shows the results of our surveys across the entire university and Table3focuses on students in our sustainability courses. We address features in the general University population first, including growth over time, variations by college major, a notable gender gap, and a comparison between CSUN and other institutions.
Table 2. Summary of results for different subgroups
| Pre | Post | ||||||
| N (% of category*) | Mean | Stdev | Mean | Stdev | |||
| All CSUN | 2993 | 52.1 | 17.7 | ||||
| Year in School | |||||||
| Freshman | 739 (25%) | 46.8 | 15.5 | ||||
| Sophomore | 808 (28%) | 48.6 | 16.5 | ||||
| Junior | 886 (30%) | 55.9 | 17 | ||||
| Senior | 483 (17%) | 61.2 | 18.2 | ||||
| Gender | |||||||
| Male | 739 (46%) | 56.6 | 16.8 | ||||
| Female | 808 (54%) | 49.0 | 16.7 | ||||
| Number of Prior SUST Courses | |||||||
| Unsure | 92 (3%) | 46.4 | 16.8 | ||||
| None | 1847 (66%) | 50.5 | 16.2 | ||||
| 1 | 617 (22%) | 56.2 | 17.0 | ||||
| 2 | 150 (5%) | 56.1 | 20.6 | ||||
| 3+ | 87 (3%) | 66.5 | 21.1 | ||||
| By Major | |||||||
| Social Behavioral Sci | 662 (23%) | 52.4 | 17.6 | ||||
| Humanities | 154 (5%) | 54.7 | 19.9 | ||||
| Health Human Dev | 428 (15%) | 49.3 | 16.4 | ||||
| Arts, Media, Comm | 413 (14%) | 52.0 | 16.8 | ||||
| Science & Math | 218 (8%) | 57.5 | 17.1 | ||||
| Engineering | 322 (11%) | 55.6 | 17.3 | ||||
| Education | 65 (2%) | 47.9 | 17.1 | ||||
| Business & Econ | 345 (12%) | 54.4 | 16.9 | ||||
| Undecided | 247 (9%) | 47.8 | 17.8 | ||||
| Currently Enrolled in SUST | |||||||
| No | 1994 (67%) | 48.2 | 16.6 | ||||
| Yes | 999 (33%) | 59.8 | 17.3 | 72.2 | 14.8 | ||
* Percentages may not add to 100 due to rounding
Table 3. Summary of results for students enrolled in SUST courses. Includes only students that completed both pretest and posttest, so the first line in this table has fewer students than the last line in Table 2even though they refer to the same category of students.
| Pre | Post | ||||||
| N (% of category*) | Mean | Stdev | Mean | Stdev | |||
| Currently Enrolled in SUST | 756 | 60.6 | 17.6 | 72.2 | 14.7 | ||
| Year in School | |||||||
| Freshman | 14 (2%) | 47.4 | 12.6 | 65.7 | 15.8 | ||
| Sophomore | 96 (13%) | 57.4 | 17.0 | 68.6 | 15.3 | ||
| Junior | 420 (56%) | 58.1 | 17.3 | 70.8 | 14.5 | ||
| Senior | 218 (29%) | 67.9 | 16.6 | 77.0 | 13.8 | ||
| Gender | |||||||
| Male | 376 (50%) | 63.8 | 17.0 | 73.9 | 13.9 | ||
| Female | 375 (50%) | 57.6 | 17.7 | 70.6 | 15.4 | ||
| Number of Prior SUST Courses | |||||||
| Unsure | 5 (1%) | 78.4 | 9.2 | 80.8 | 15.8 | ||
| None | 354 (52%) | 56.7 | 16.3 | 68.5 | 13.9 | ||
| 1 | 216 (32%) | 60.4 | 16.2 | 72.6 | 13.7 | ||
| 2 | 56 (8%) | 68.4 | 15.7 | 75.4 | 14.5 | ||
| 3+ | 50 (7%) | 75.4 | 13.8 | 79.6 | 13.1 | ||
| By Major | |||||||
| Social Behavioral Sci | 178 (25%) | 59.5 | 18.2 | 71.6 | 14.4 | ||
| Humanities | 39 (5%) | 66.5 | 19.2 | 74.4 | 14.0 | ||
| Health Human Dev | 93 (13%) | 59.5 | 16.5 | 71.1 | 15.3 | ||
| Arts, Media, Comm | 106 (15%) | 56.4 | 17.8 | 70.4 | 15.0 | ||
| Science & Math | 56 (8%) | 66.6 | 14.1 | 77.4 | 13.4 | ||
| Engineering | 93 (13%) | 63.3 | 17.0 | 75.3 | 14.7 | ||
| Education | 20 (3%) | 55.4 | 17.5 | 71.8 | 12.9 | ||
| Business & Econ | 82 (11%) | 64.9 | 14.8 | 73.6 | 13.1 | ||
| Undecided | 57 (8%) | 59.0 | 18 | 69.7 | 14.7 | ||
| Current SUST Course | |||||||
| 300/310 | 710 (94%) | 59.4 | 17.4 | 71.7 | 14.7 | ||
| 401 | 46 (6%) | 79.0 | 9.4 | 80.5 | 11.8 | ||
* Percents may not add to 100 due to rounding
Table 4. Results from student t-test comparisons of select cases
| Comparison (1 v. 2) | Mean1 ± Stdev1 (n1) | Mean2 ± Stdev2 (n2) | Difference | p | |
| Male v. Female | 56.6±17.5 (1329) | 49±16.8 (1584) | 7.6 | <0.001 | ** |
| Academic Year | |||||
| Sophomore v. Freshman | 48.6±16.5 (808) | 46.8±15.5 (739) | 1.8 | 0.027 | * |
| Junior v. Sophomore | 55.9±17 (886) | 48.6±16.5 (808) | 7.3 | <0.001 | ** |
| Senior v. Junior | 61.2±18.2 (483) | 55.9±17 (886) | 5.3 | <0.001 | ** |
| Senior v. Freshman | 61.2±18.2 (483) | 46.8±15.5 (739) | 14.4 | <0.001 | ** |
| Num Prior SUST Courses (SUST Pre-test) | |||||
| 1 v. 0 | 60.4±16.2 (216) | 56.7±16.3 (354) | 3.7 | 0.009 | * |
| 2 v. 1 | 68.4±15.7 (56) | 60.4±16.2 (216) | 8 | <0.001 | ** |
| 3+ v. 2 | 75.4±13.8 (50) | 68.4±15.7 (56) | 7 | 0.016 | * |
| 3+ v. 0 | 75.4±13.8 (50) | 56.7±16.3 (354) | 18.7 | <0.001 | ** |
| Pre/Post | |||||
| SUST Post v. SUST Pre | 72.2±14.8 (756) | 59.8±17.3 (999) | 12.4 | <0.001 | ** |
| SUST Pre v. CSUN ALL Pre | 59.8±17.3 (999) | 48.2±16.6 (1994) | 11.6 | <0.001 | ** |
| SUST 300/310 Post v. Pre | 71.7±14.7 (710) | 59.4±17.4 (710) | 12.3 | <0.001 | ** |
| SUST 401 Post v. Pre | 80.5±11.8 (46) | 79±9.4 (46) | 1.5 | 0.502 | |
Growth Over Time
We find our general population of students improve their sustainability knowledge with each successive year of general coursework (Figure1). This points to a degree of success in our campus sustainability efforts – our President’s identification of sustainability as one of her seven university priorities (https://www.csun.edu/investiture/csun-shines-next-decade-planning-and-priorities-engaged-institution)(Harrison, 2014), our goal to implement university-wide sustainability education for all students (Institute for Sustainability, 2013), our efforts to communicate sustainability to the wider campus community (Institute for Sustainability, 2013), and our ACUPCC commitment to “provide … informed graduates to create a positive and sustainable future” (CSUN, 2015). Growth from freshman year to sophomore year is the smallest change, though still statistically significant (Table4). Only 2% of the students in sustainability courses are freshmen, so very few students have peers that have experience in our courses. Efforts to promote sustainability at new student orientations could improve recruitment of freshmen into SUST courses and to raise overall awareness of the campus’ sustainability efforts.
Scores Compared to Other Institutions
Like other institutions administering similar instruments, we see a consistent pattern of student scores increasing from freshman year through senior year (Figure1). While the rate of improvement is similar at different institutions, our students know less about sustainability than other universities that have administered these assessments. Ohio State and Wartburg college are considerably more selective than CSUN, with the mean SAT scores at CSUN around the 50thpercentile, near the 75thpercentile at Wartburg College, and above 90thpercentile at Ohio State. CSUN is also a minority-serving institution with a regional focus. Beyond academic preparation, there may be cultural differences since CSUN is a minority-serving institution with 64% minorities (Table1) while Ohio State and Wartburg have only have 19% and 11% minority students, respectively. Attitudes and knowledge about sustainability can be influenced by a range of factors, including the urban/rural divide (O’Brien, 2007; Tikka et al., 2000)and ethnicity (Johnson et al., 2004; Morrone et al., 2001; Zimmermann, 1996). Unfortunately, our existing survey instrument did not inquire about ethnicity and we cannot determine which of these factors contribute most to the differences between CSUN and other institutions.
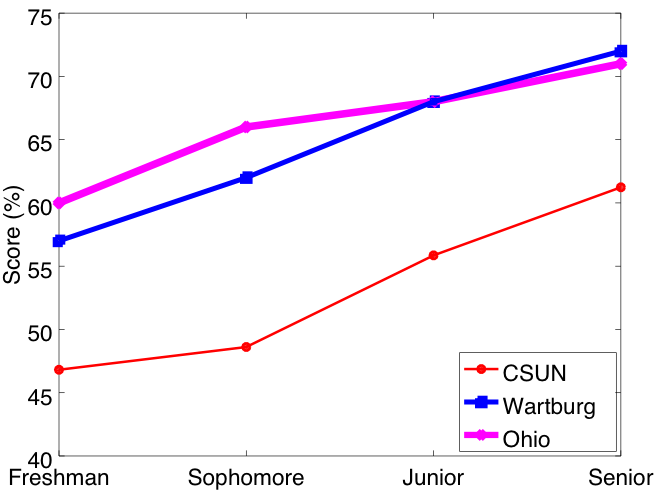
Figure 1. Growth in sustainability knowledge at different universities over four years of college. Data from Ohio State (Zwickle, Koontz, Slagle, et al., 2014)and Wartburg College (Wartburg College, 2015).
Domains of Sustainability
Following the coding specified in the ASK survey, we divided the questions into the three domains of sustainability: environment, social, and economy (Figure2). Comparing the institution-wide results, CSUN has less overall sustainability knowledge than Ohio State and University of Wisconsin-La Crosse in all three pillars. CSUN SUST students score higher on the post-test than the general population at Ohio State, which is not surprising considering they have completed coursework in sustainability. Interestingly, a higher percentage of CSUN SUST students score correctly on questions related to economic sustainability on the post-test than at other institutions. Does this reflect a relative strength in the instruction at CSUN in this area? Or perhaps CSUN’s primarily low income, underserved population is more receptive to learning about issues of economic sustainability because they struggle with them more directly. More investigation needs to be done into this question.
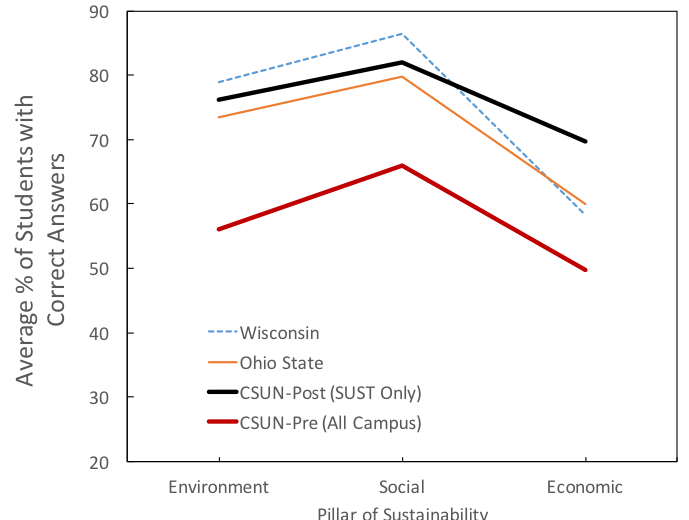
Figure 2. Scores broken out by pillar of sustainability for CSUN, Ohio State (Zwickle, Koontz, Slagle, et al., 2014), and University of Wisconsin-La Crosse (University of Wisconsin, 2015).
Gender Gap
On average, males score 7.6 percentage points higher than women on our assessment (p<0.001). Why do men begin their tertiary education with more sustainability knowledge on average than women? In our specific case, we hypothesized this might be due to the distribution of majors in the courses and the gender differences contained in those majors. For example, if engineering majors began with more sustainability knowledge than other majors and engineering is dominated by men, this would contribute to a gender gap in sustainability knowledge. However, this hypothesis is not supported by the data. The gender gap appears in data for every college, though to varying degrees and is only statistically significant in 5 of the 9 colleges (Table4).
The gender gap is a robust and persistent feature in our data, which mirrors the findings of other international studies of environmental literacy described in the introductory section of this paper. In one such study, Gendall and Smith (1995)show that the gender gap shrinks with increasing levels of education. By the end of the coursework in our sustainability minor program, the gender gap is closed (Figure3). While the gender gap on the pre-test for the general population is 7.6 points, it is only 6.2 points for students enrolled in SUST courses (statistically distinct at p < 0.001) due to selection effects described later. By the post-test for the 300-level SUST courses, the gap shrinks to just 3.4 points (still statistically distinct according to a t-test, p = 0.002). By the end of the capstone course in our minor, SUST 401, the remaining gap is statistically insignificant (males 80.9 ± 11.5 v. females 80.2 ± 12.2, statistically identical with p = 0.842, though we only have data for two sections of 401).
What accounts for the closing of the gap? In college physics courses, students scored better when they were taught by a professor of their same gender (Sadler & Tai, 2001). Since 76% of our students experienced SUST courses taught by female instructors, we tested our own data but found no meaningful correlation between instructor gender and student performance. One of our female instructors consistently had females experiencing greater gain from pre- to post-test, one female instructor consistently had the opposite, and one had virtually identical growth for both males and females. For the two male instructors, females consistently experienced greater gains than males.
Table 5. Gender gap
| % Male°
CSUN/Sample |
Male°° | Female°° | Gap°°° | p | ||
| Overall | 46/46% | 56.6±17.5 (1329) | 49±16.8 (1584) | 7.6 | <0.001 | ** |
| Academic Year | ||||||
| 1 | 45/40% | 50.9±16.5 (295) | 44±14.2 (440) | 6.9 | <0.001 | ** |
| 2 | 47/46% | 52.6±16.9 (372) | 45.3±15.3 (429) | 7.3 | <0.001 | ** |
| 3 | 46/49% | 60.2±16.8 (429) | 51.9±16.2 (449) | 8.3 | <0.001 | ** |
| 4 | 49/47% | 64.3±16.5 (226) | 58.9±19.1 (253) | 5.4 | <0.001 | ** |
| Major College | ||||||
| Social Behavioral Sci | 32/38% | 58.8±16.4 (254) | 48.6±17.2 (404) | 10.2 | <0.001 | ** |
| Humanities | 28/33% | 58.6±19.4 (51) | 53.8±19.9 (96) | 4.8 | 0.159 | |
| Health Human Dev | 31/28% | 56.4±15.8 (119) | 46.6±15.9 (306) | 9.8 | <0.001 | ** |
| Arts, Media, Comm | 47/48% | 57.2±17.1 (198) | 47.1±14.9 (214) | 10.1 | <0.001 | ** |
| Science & Math | 42/42% | 59.4±16.9 (91) | 56.5±16.9 (126) | 2.9 | 0.214 | |
| Engineering | 88/82% | 56.5±17.7 (263) | 51.2±14.7 (57) | 5.3 | 0.018 | * |
| Education | 15/29% | 50.7±22.2 (19) | 46.7±14.7 (46) | 4.0 | 0.473 | |
| Business & Econ | 58/59% | 57±16.7 (202) | 50.7±16.7 (143) | 6.3 | <0.001 | ** |
| Undecided | 46/40% | 50.2±19.6 (99) | 46.1±16.4 (145) | 4.1 | 0.088 | |
| SUST Courses | ||||||
| 300/310 Pre | NA/50% | 62.8±16.8 (354) | 56.2±17.3 (351) | 6.6 | <0.001 | ** |
| 300/310 Post | NA/50% | 73.4±13.9 (354) | 70±15.4 (351) | 3.4 | 0.002 | * |
| 401 Pre | NA/48% | 80.4±9.4 (22) | 77.8±9.4 (24) | 2.6 | 0.354 | |
| 401 Post | NA/48% | 80.9±11.5 (22) | 80.2±12.2 (24) | 0.7 | 0.842 |
* statistically significant at p < 0.05; ** statistically significant at p < 0.001
° % male reports the fraction of the students that are male in each group on the campus overall / in our sample; °° Column shows mean ± 1 standard deviation (number of participants); °° Gap is mean male score – mean female score.
Based on the documented influence of early experiences on sustainability literacy (O’Brien, 2007; Tikka et al., 2000), it seems possible that females use their education to ‘catch up’ on a deficiency of background knowledge and experiences. This process seems to take sustained learning over many semesters.
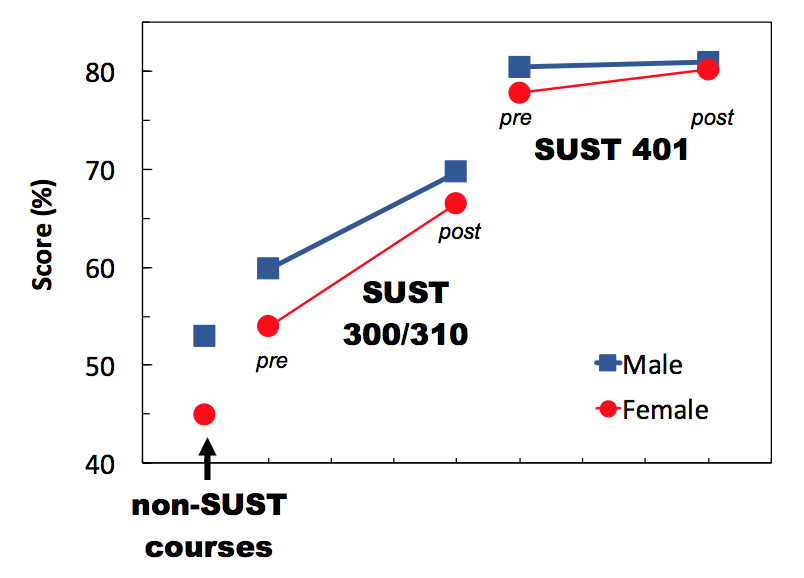
Figure 3. Knowledge gains in SUST courses for different genders, as measured at different points in our University SUST program. Data for non-SUST and SUST 300/310 courses are for students that self-report never having taken a SUST course before taking the test.
Selection Effects in SUST Courses
Students in our sample taking sustainability courses have, on average, a higher prior knowledge of the subject. To see whether students with more prior sustainability knowledge were self-selecting into related courses, we looked at only the students who had taken no previous sustainability courses. We found a statistically significant difference of 8.2±1.0 points (half a standard deviation, p <0.001) between those in our sustainability courses and those taking general coursework (Table5). In practice, our 300-level courses fulfill general education requirements, and anecdotally they attract a number of people who weren’t previously aware of the concept of sustainability. Nevertheless, the data show that on average, students who enroll in their first sustainability course already know more about sustainability than their peers.
Table 6. Pre-test scores for students with no prior sustainability courses.
| Course type | N | Mean ± 1 std. dev |
| SUST | 332 | 56.5 ± 16.1 |
| non-SUST | 1348 | 48.3 ± 15.8 |
SUST Courses Improve Content Knowledge
Students grow in their knowledge throughout the sustainability minor program. Their sustainability knowledge increases by an average of 12 points after taking a sustainability course (p < 0.001; Figure4). Both the core SUST courses (Figure3) and related sustainability coursework in the minor appear to have an impact because pre-test scores correlate strongly with the number of total sustainability courses the student has taken prior to the test (Figure5).
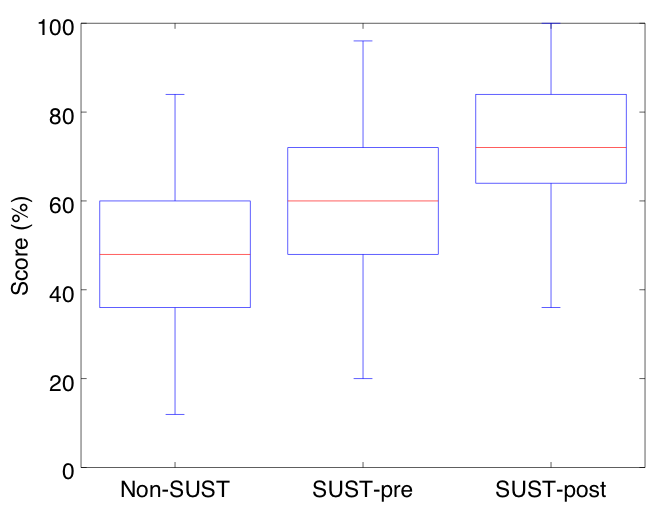
Figure 4. Box plots of sustainability knowledge by students in non-SUST courses and the beginning and end of SUST courses. Red lines indicate median and whiskers illustrate the entire range of data.
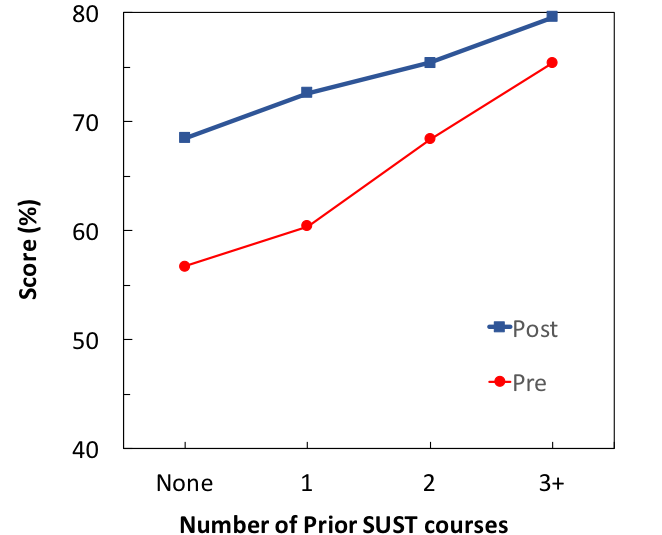
Figure5. Effect of prior SUST coursework on pre-test and post-test scores.
Do SUST courses serve certain majors better than others?
Students from the colleges of Science & Math and from Humanities have the highest pre-test scores in our sample. Yet, Science & Math majors improve more than Humanities majors from taking our sustainability courses (Figure6). Our sustainability classes are designed to be highly interdisciplinary, yet the discrepancy between the rates of learning for students from different majors warrants further examination of our methods of teaching. Are we catering more to science and math students or favoring students of one kind of background? We recommend future teaching observation and evaluations look for ways in which the curriculum or instructor delivery style might favor science, engineering, and education majors over humanities, business, or other majors.
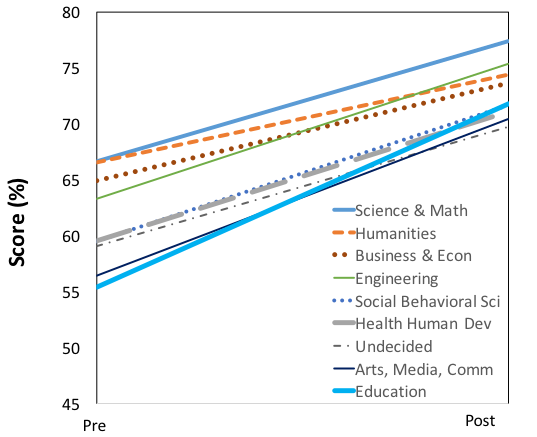
Figure 6. Growth by different majors in SUST courses from pre-test to post-test
Multiple Regression
Which factors discussed above most influence sustainability knowledge outcomes? We performed a multiple regression analysis on the quantitative data available to explore the relative importance of factors that influence students’ initial content knowledge. The analysis yielded an estimate of the coefficient of each predictor variable from the linear model, an estimate of each predictor variable’s level of statistical significance, and the portion of the variation of the knowledge assessment score that can be explained due to variation in each predictor variable. The results are shown in Table6.
Table 7. Multiple linear regression to predict pre-test score
| Variable | Coefficient ± SE | Variance Explained | p |
| Intercept | 46.6 ± 0.9 | – | <0.001* |
| Gender | -6.7 ± 0.6** | 0.041 | <0.001* |
| Currently enrolled in SUST | 5.9 ± 0.8 | 0.048 | <0.001* |
| Academic Years in College | 2.7 ± 0.3 | 0.048 | <0.001* |
| Num prior SUST courses | 2.7 ± 0.4 | 0.024 | <0.001* |
| OVERALL | 0.160 | <0.001* |
* Statistically significant at p < 0.001. n=2,680 students.
** Negative number indicates females score lower
Gender, enrollment in a SUST course, number of academic years in college, and number of prior SUST courses are all statistically significant variables at the p<0.001 level. Overall, 16% of the variance can be explained by the factors studied. Gender has a higher effect on score than any of the other variables, equivalent to the completion of about 2.5 previous sustainability courses. We already discussed the selection effect where students with higher prior sustainability knowledge preferentially enroll in SUST courses, and the regression finds this to be the second most important factor in predicting student scores. Each year in college and each semester taking a sustainability course each add about 2.7 percentage points onto a student’s score, on average. The regression predicts that a male enrolled in a fourth sustainability course during senior year will score 71.3%, while a female enrolled in a general education course during freshman year will score a 42.5%. There are 340 real females in our sample that meet this exact specification. While their mean score is 44.3%, scores range from 12% up to 84%. The regression clearly does not capture all the variations in student performance.
Conclusions
Our findings demonstrate that our institution is effectively improving student sustainability knowledge, both in sustainability courses and throughout the curriculum. Both academic year and number of SUST courses show a statistically significant correlation with improved knowledge.
Our students enter college with less sustainability knowledge than Ohio State and Wartburg, which most likely is influenced by both our lower selectivity and the cultural background of our students. Further study is recommended to determine the relative importance of each of these variables. While their knowledge in sustainability grows at the same pace as it does at other institutions, they still graduate with less knowledge than students at the other two schools.
There is a pronounced gender gap in sustainability knowledge when students enter the university, consistent with other literature; the gender gap closes by the end of completion of the sustainability minor. The gender gap cannot be explained by the distribution of majors who choose to take sustainability courses.
Students with more sustainability knowledge self-select sustainability coursework. However, students in different majors increase their sustainability knowledge at different rates once they enter related courses.
These data imply several actionable items. First, future studies should collect race and ethnicity data in order to examine the effect of this variable on sustainability knowledge and determine whether our lower overall sustainability scores are influenced by the cultural background of our students. Second, sustainability instructors should be made aware of (1) the gender gap, (2) the lower incoming sustainability knowledge of our students and the likely influence of ethnic/cultural background, and (3) the different rates of growth in sustainability knowledge for different majors. They should think carefully along with department administrators about ways to address these findings in their instruction styles and in classroom discussions. Observers and evaluators of instructors should also be aware of these issues during their observations in order to look for opportunities to improve any classroom biases based on backgrounds such as gender, ethnicity, socioeconomic status, or major. Finally, individual sustainability instructors should be given aggregated question-by-question results for each course so they can see which specific questions students were least likely to answer correctly and possibly make curriculum adjustments. In this way, our findings will enable us to strengthen our sustainability coursework and make further progress in campus sustainability knowledge.
References
AASHE. (2017, July). STARS Technical Manual ver 2.1, Administrative Update Three. Association for the Achievement of Sustainability in Higher Education. Retrieved from http://www.aashe.org/wp-content/uploads/2017/07/STARS-2.1-Technical-Manual-Administrative-Update-Three.pdf
Barnes, N. (2014). Institutional Attempts To Measure Student Sustainability Knowledge. Sustainability: The Journal of Record, 7(2), 104–108. https://doi.org/10.1089/SUS.2014.9803
Brown, P. (1995). Race, Class, and Environmental Health: A Review and Systematization of the Literature. Environmental Research, 69(1), 15–30. https://doi.org/10.1006/enrs.1995.1021
Brulle, R. J., & Pellow, D. N. (2006). ENVIRONMENTAL JUSTICE: Human Health and Environmental Inequalities. Annual Review of Public Health, 27(1), 103–124. https://doi.org/10.1146/annurev.publhealth.27.021405.102124
Caron, J. A. (1989). Environmental Perspectives of Blacks: Acceptance of the “New Environmental Paradigm.” The Journal of Environmental Education, 20(3), 21–26. https://doi.org/10.1080/00958964.1989.9942785
Coyle, K. (2005). Environmental Literacy in America: What Ten Years of NEETF/Roper Research and Related Studies Say about Environmental Literacy in the U.S. National Environmental Education & Training Foundation. Retrieved from https://eric.ed.gov/?id=ED522820
CSUN. (2015, March 13). ACUPCC: CSUN’s Climate Commitment. Retrieved October 10, 2017, from http://www.csun.edu/sustainability/acupcc
Gendall, P., Smith, T. W., & Russell, D. (1995). Knowledge of scientific and environmental facts: a comparison of six countries. Marketing Bulletin, 6, 65–74.
Harrison, D. (2014, February 7). Help Make CSUN Shine Brighter – Sustainability. Retrieved October 10, 2017, from http://www.csun.edu/president/help-make-csun-shine-brighter-%E2%80%93-sustainability
Hartman, C.-J. B., DeMars, C. E., Griscom, H. P., & Butner, H. M. (2017). Assessment of undergraduate students’ environmental stewardship reasoning and knowledge. International Journal of Sustainability in Higher Education, 18(4), 492–502. https://doi.org/10.1108/IJSHE-07-2015-0128
Horvath, N., Stewart, M., & Shea, M. (2013). Toward Instruments of Assessing Sustainability Knowledge: Assessment development, process, and results from a pilot survey at the University of Maryland « Journal of Sustainability Education. Journal of Sustainability Education, 5. Retrieved from http://www.susted.com/wordpress/content/toward-instruments-of-assessing-sustainability-knowledge-assessment-development-process-and-results-from-a-pilot-survey-at-the-university-of-maryland_2013_06/
Institute for Sustainability. (2013). CSUN Sustainability Plan, 2013-2023(p. 78). Northridge, CA: California State University Northridge. Retrieved from http://www.csun.edu/sites/default/files/CSUN_Sust_Plan-m.pdf
Johnson, C. Y., Bowker, J. M., & Cordell, H. K. (2004). Ethnic Variation in Environmental Belief and Behavior: An Examination of the New Ecological Paradigm in a Social Psychological Context. Environment and Behavior, 36(2), 157–186. https://doi.org/10.1177/0013916503251478
Morrone, M., Mancl, K., & Carr, K. (2001). Development of a Metric To Test Group Differences in Ecological Knowledge as One Component of Environmental Literacy. Journal of Environmental Education, 32(4), 33–42.
National Environmental Education and Training Foundation. (1998). The National Report Card on Environmental Knowledge, Attitudes and Behaviors: The Seventh Annual Survey of Adult Americans. Washington, D.C.
O’Brien, S. R. M. (2007). Indications of environmental literacy: Using a new survey instrument to measure awareness, knowledge, and attitudes of university-aged students(M.S.). Iowa State University, United States — Iowa. Retrieved from https://search.proquest.com/docview/304854480/abstract/52A0B50F79024114PQ/1
Sadler, P. M., & Tai, R. H. (2001). Success in Introductory College Physics: The Role of High School Preparation. Science Education, 85(2), 111–36.
Szasz, A., & Meuser, M. (1997). Environmental Inequalities: Literature Review and Proposals for New Directions in Research and Theory. Current Sociology, 45(3), 99–120. https://doi.org/10.1177/001139297045003006
Tikka, P. M., Kuitunen, M. T., & Tynys, S. M. (2000). Effects of Educational Background on Students’ Attitudes, Activity Levels, and Knowledge Concerning the Environment. The Journal of Environmental Education, 31(3), 12–19. https://doi.org/10.1080/00958960009598640
United Nations. (2005). 2005 World Summit Outcomes. Retrieved from http://www.who.int/hiv/universalaccess2010/worldsummit.pdf
University of Wisconsin. (2015). AC-6: Sustainability Literacy Assessment, University of Wisconsin-La Crosse. Retrieved October 12, 2017, from https://stars.aashe.org/institutions/university-of-wisconsin-la-crosse-wi/report/2015-05-20/AC/curriculum/AC-6/
Wartburg College. (2015). AC-6: Sustainability Literacy Assessment, Wartburg College. Retrieved October 12, 2017, from https://stars.aashe.org/institutions/wartburg-college-ia/report/2015-01-29/AC/curriculum/AC-6/
Zimmermann, L. K. (1996). Knowledge, Affect, and the Environment: 15 Years of Research (1979–1993). The Journal of Environmental Education, 27(3), 41–44. https://doi.org/10.1080/00958964.1996.9941466
Zwickle, A., Koontz, T. M., Bodine, A., Slagle, K. M., & McCreery, A. C. (2014). Assessment of Sustainability Knowledge: Question Domains(No. ESSL ASK2-2014) (p. 7). https://ess.osu.edu/sites/essl/files/imce/28%20ASK%20questions%20by%20domain.pdf. Retrieved from https://ess.osu.edu/research/assessment-sustainability-knowledge-ask
Zwickle, A., Koontz, T. M., Slagle, K. M., & Bruskotter, J. T. (2014). Assessing sustainability knowledge of a student population: Developing a tool to measure knowledge in the environmental, economic and social domains. International Journal of Sustainability in Higher Education, 15(4), 375–389. https://doi.org/10.1108/IJSHE-01-2013-0008


 Dr. Loraine Lundquist, loraine.lundquist@csun.edu, is a faculty associate at the Institute for Sustainability at CSUN. On campus, she assists with climate action and sustainability planning, sustainability curriculum development, and teaching courses in sustainability best practices and applied sustainability. She directs several projects working with local teachers on energy and water efficiency issues and is an active advocate about regional energy and climate policy.
  Kiana Lucero, ki_13@hotmail.com, graduated from CSUN in 2016 with a B.S. in marine biology and a minor in sustainability. She was a Project Coordinator at the CSUN Institute for Sustainability for 2 years, helping to organize multiple grants, assist with research, and expand department outreach. She is now a zookeeper at Tanganyika Wildlife Park.
  Dr. Helen Cox, hcox@toaks.org, is currently the Sustainability Division Manager for the City of Thousand Oaks, but was previously the director of CSUN’s Institute for Sustainability. Between 2009 and 2016, she oversaw the campus’ growth as a sustainability leader. She led the development of the campus’ sustainability and climate action plans and its sustainability curriculum, and was instrumental in CSUN’s achievement of an AASHE STARS gold rating. She directed numerous grants to support interdisciplinary sustainability research, education, and outreach.