


Case Study: Urban revival and appropriate storm water management (Youngstown State University)

Korenic JSE March 2020 Water Issue PDF
Link to JSE March 2020 Water and Climate Issue Table of Contents
Abstract
Youngstown State University, an Urban Research Institution located in Youngstown, Ohio (Mahoning County), has experienced significant infrastructure improvements over the last several years. The improvements center around new dormitories, academic buildings and parking areas located to the south of the campus. Prior to these additions, the improved areas were parking lots, grass and tree areas and other structures that were subsequently demolished to make room for the infrastructure improvements. Due to the aforementioned activity, the storm water patterns, drainage and quantities were increased causing storm water runoff accumulations and significant ponding on Rayen Avenue and Belmont Avenue which meet at the south end of campus.
This situation is not abnormal. Every urban area that is revitalized with new buildings and parking structures undergoes a significant change in storm water runoff patterns and areas of drainage or groundwater recharge. At Youngstown State University, there has been no known attempt to quantify the amount of change (increase) of runoff from the original conditions to the current. The focus of this research will be two – fold. First, to find accurate quantities of runoff (pre and post development improvements) and expand on sustainable storm water management techniques that can be incorporated in urban areas including bioswales and rain gardens. Second, to include a group of sophomore engineering technology students in a meaningful, real world engineering technology analysis project similar to what they will be completing while practicing. (storm water, runoff, drainage, mapping)
Theoretical Background, Mapping and Land Use Study:
This research will center completely around calculating accurate storm water quantity volumes on the campus of Youngstown State University using the modified rational method. This research was incorporated in a sophomore level class in Civil and Construction Engineering Technology (CCET) program. The course, CCET 3724 – Hydraulics and Land Development functions as part of the programs associate’s degree mini-capstone course. The mini capstone serves as the final project for students who use the AAS in CCET as their terminal degree.
The students in this class, guided by their faculty member, completed a detailed campus land use study using mapping provided by the Mahoning County Engineers Office. ArcGIS was the mapping program of choice because that is what is used by our supporting agency (the Mahoning County Engineers Office). Two different sets of maps were used to do the land use study. The first maps (dated 2008) were used to estimate pre-developed land use statistics. In order to estimate updated land use on campus, the grounds of the campus were toured, noting significant changes (there were not many in the area contributing to storm water runoff) during the Spring of 2019. This is a significant development in this project since GIS mapping for stormwater usage began in approximately 2010 (Friedlander, 8/2019). In practice, ArcGIS Online can be used by non-GIS users to increase accurate communication between any municipality and the engineering technologists involved in the analysis (Friedlander, 8/2019). The pre – developed and post – developed land use statistics used in this study are listed in the table below.
Table 1: Land Use
| YSU Campus Area Estimated Land Use Statics | |||
| Pre Developed Conditions | Post Developed Conditions | ||
| Area Type | Percentage (%) | Area Type | Percentage (%) |
| Residential | 25 | Roads/Paved | 25 |
| Grass/Lawn | 25 | Grass/Lawn | 10 |
| Urban/Business | 50 | Urban/Business | 65 |
The data in the table above was used by each student to calculate the pre and post developed rational method “C” value. This value indicates how pervious or impervious the land on and surrounding campus will be. High values indicate paved/urban areas which encourage higher runoff rates. Low values indicate pervious areas which promote storm water infiltration. The “C” values used in each category of land use were taken from the “Mahoning County Drainage Criteria and Storm Water Manual” (Mahoning County Manual, 7/2019). The calculation shown below is the pre and post developed “C” value for the 95 acre campus and surrounding areas which contribute to the runoff problem.
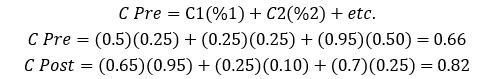
The pre developed “C” value of 0.66 indicates that the drainage area is 66% impervious while the post developed value indicates 82% imperious.
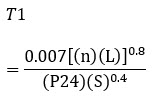
Following the calculation of the land use coefficient, travel times of runoff were calculated using the flow lengths and equations that are summarized in the table below. As is customary with storm water volume calculations, flow types are modeled using overland flow, shallow concentrated flow, and channelized flow in both pre and post developed conditions. As an engineering technologist, the students must choose flow lengths for each type which are in the industry accepted range. The equations and flow lengths in the table below were used by each student to calculate the storm water travel times across the entire campus. These times are known as the time of concentration which is the time it takes for water to travel from one end of the drainage basin to the other. The total pre-developed time and post-developed time were then used to identify the rainfall intensity values in the Mahoning County Manual (figure 2) (Mahoning County Manual, 7/2019).
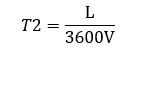
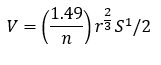
We would be remiss if we did not define several of the variables in each of the equations listed in the table below. The value of each variable can be located in the Mahoning County Manual (Mahoning County Manual, 7/2019).
- n = (overland flow roughness coefficient, unitless) – Figure 1
- P24 = 24 hour cumulative rainfall (in.) – Figure 2
- S = average land slope (ft/ft) – from mapping
- V = velocity (shallow conc. flow) = from nomograph – Figure 3
- V = (Manning’s Equation): calculated directly for channelized flow
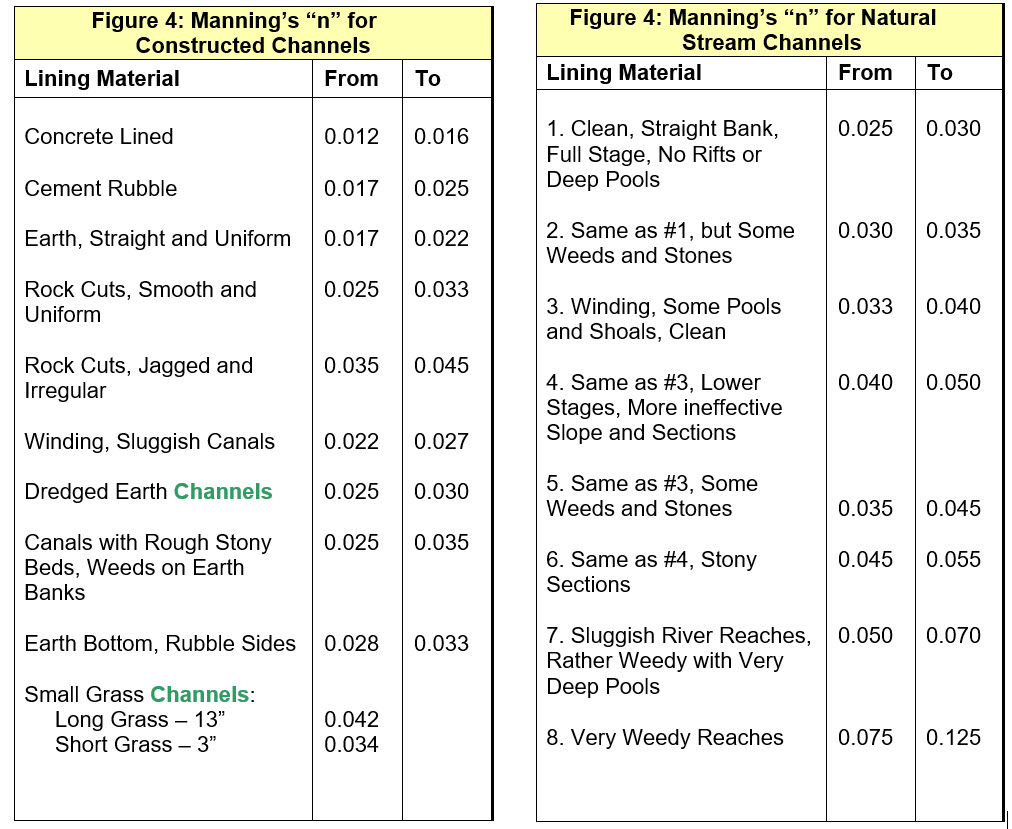
- n = (channel material roughness coefficient) – Figure 4
- r = hydraulic radius (ft) of channel (area/wetted perimeter)
Table 2: Travel Time
| Pre and Post Developed Flow Lengths and Travel Time Equations | |||
| Pre Developed Conditions | Post developed Conditions | ||
| Flow Type | Length (ft.) | Flow Type | Length (ft.) |
| Overland | 100 | Overland | 50 |
| Shallow Conc. | 300 | Shallow Conc. | 100 |
| Channelized | 7600 | Channelized | 7850 |
| Overland Flow | Shallow Conc. Flow | Channel Flow | |
 |
 |
 |
|
| n = Mannings Coef.
P24 = 2 yr., 24 rainfall S = slope |
V from nomograph (figure 3) | V from Mannings Eq.
|
|
The results of travel time/time of concentration calculations are as follows:
- Travel Time (pre – developed conditions): approximately 33 minutes
- Travel Time (post-developed conditions): approximately 31 minutes
Once we calculated the applicable travel times from the values listed above we are now able to refer to Table 2-2 in the Mahoning County Manual to use the time of concentration (travel time) values to locate the design storm (2 yr., 5 yr., 10 yr., etc.) rainfall intensity (i) with units of (in/hr.) (Mahoning County Manual, 7/2019). Following the identification of the rainfall intensity values we were able to calculate each storm water volume for each design storm using the modified rational equation with is listed below.
![]()
The table below lists the storm water runoff volume calculations. Included are two sample calculations (1 for pre – developed conditions and 1 for post – developed conditions).
= 1.008(0.66)(1.87)(95 acres) = 117 cubic feet per second (cfs)
= 1.008(082)(1.98)(95 acres) = 150 cfs
Table 3: Calculated Flow Values:
| Pre – Developed Q (cfs) | Post – Developed Q (cfs) |
| 117 | 150 |
| 188 | 246 |
| 207 | 272 |
Conclusions & Recommendations:
The students who were enrolled in this course (Spring 2019 semester) were not only tasked with performing accurate storm water volume runoff calculations. They were also asked to formulate, using the calculations and other pertinent information, a set of conclusions about the storm water issue and to make a list of recommendations. All of the conclusions and recommendations were presented at Quest which is a student research festival on the campus of Youngstown State University.
The following is a list of conclusions and recommendations that were agreed upon by the entire Youngstown State University Civil and Construction Engineering Technology (CCET) 3724: Hydraulics and Land Development class.
- Flooding is primarily due to insufficient pipe sizes and clogging of existing pipes
- Old infrastructure – cracked old combined sewers
- Recommended rerouting flow – to other intermediate catchments to minimize flow to lower areas of campus.
- Recommended bioswale and rain garden at various campus locations to limit the scale of runoff at lower levels of campus
- Recommended water collection and reuse on campus (for watering trees/shrubs/perennials etc.)
- A special thanks to Mr. Patrick Ginnetti, Mahoning County Engineer, for his willingness to provide the GIS mapping necessary for accurate land use and storm water volume calculations.
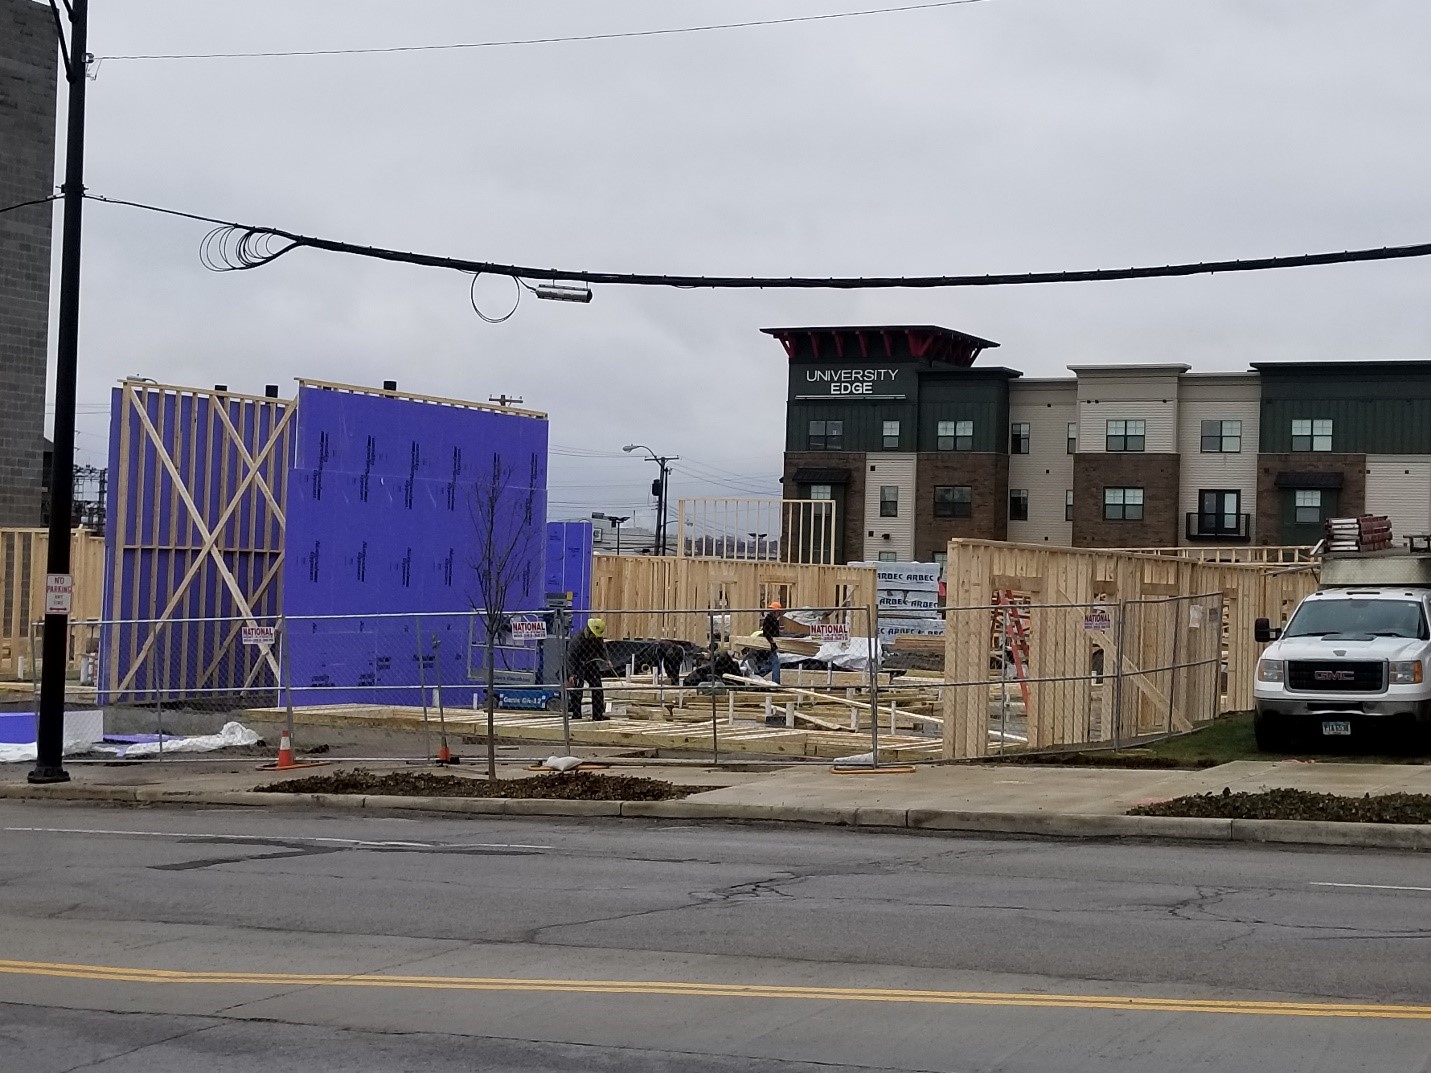
Photos of the new (phase 1 in background) and current construction phase 3 of the University Edge apartment complexes.
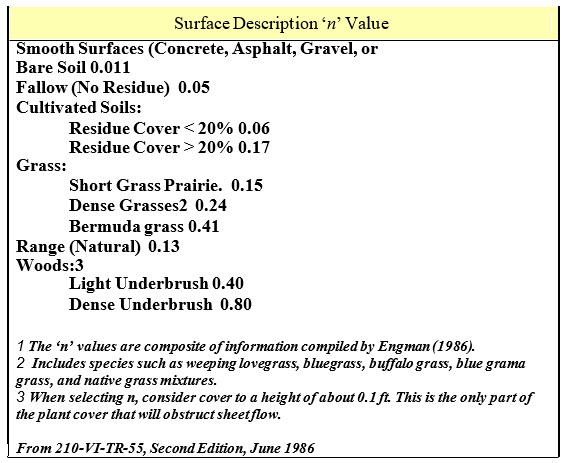
Figure 1: Surface Description – Mannings “n”
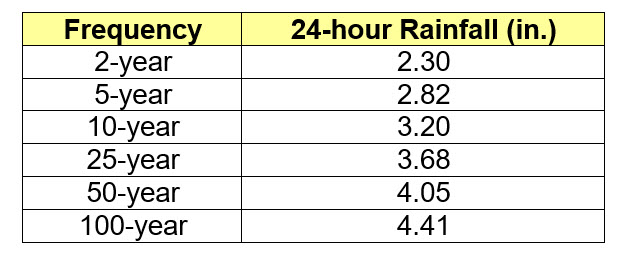
Figure 2: 24-Hour Cumulative Rainfall, P
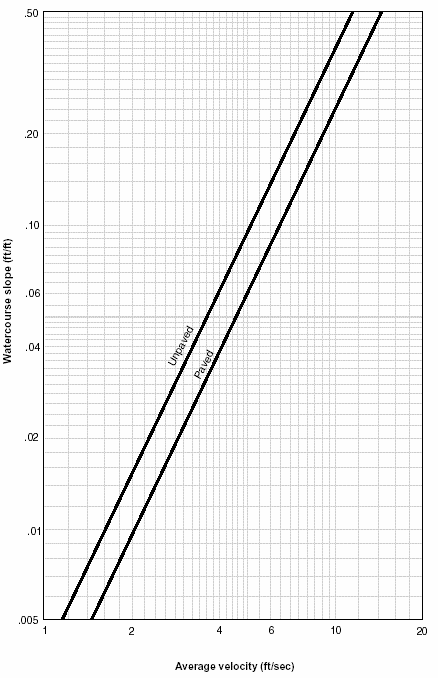
FIGURE 3: Average Velocities for Estimating Travel Time for Shallow Concentrated Flow
Adapted from Handbook of Hydraulics, Sixth Edition, Brater & King
Works Cited:
- “Mahoning County Drainage Criteria and Storm Water Manual”
http://www.mahoningcountyoh.gov/DocumentCenter/View/103/Storm-Water-Manual-with-Cover-PDF?bidId=
- Friedlander, E; GIS and Asset Management, An Effective Stormwater Planning Tool:
http://proceedings.esri.com/library/userconf/water18/papers/Water-40.pdf
- Brater, E. & King, H et. Al: “Handbook of Hydraulics” Sixth edition, McGraw Hill.


 Robert J. Korenic is currently an Associate Professor of Civil and Construction Engineering Technology at Youngstown State University 44555, USA. He earned a Bachelor of Engineering in Civil Engineering and a Master of Science in Environmental Engineering from Youngstown State University. He has approximately eleven years of work experience in water resources planning and management and in the wood and light gauge steel roof truss industry. He teaches a variety of courses including hydraulics and land development, properties and strength of materials and sustainable design pertaining to Leadership in Energy and Environmental Design (LEED). Prof. Korenic can be reached at rjkorenic@ysu.edu.