


Refinement of an Energy Literacy Rubric for Artifact Assessment and Application to the Imagine Tomorrow High School Energy Competition
Langfitt et al JSE Vol 8 Jan2015 PDF Ready
Abstract: National efforts in energy education aim to increase energy literacy and a diverse set of tools is needed to assess the effectiveness of different educational endeavors. As an alternative to the standard testing-based approach for determining individual energy knowledge, this research further advances a rubric-based approach for assessing the energy literacy manifested in artifacts of a competition or project. The goals were to add additional validity, determine if revisions to the rubric and assessment process increased reliability over the initial study on abstracts, and to determine how well suited the approach is for application to posters – the final deliverable of the competition. The rubric was applied to abstracts and posters from Imagine Tomorrow, a high school energy competition, and the resulting scores were analyzed for both standard rater reliability measures and variable-linked trends. Results showed that interrater reliability on the abstract assessment was similar to that of the previous study, the poster assessment showed much higher reliability than the abstract assessment, and many of the same energy literacy trends identified in the previous research were present with additional data allowing for further trend investigation in this study. While this refinement did not appear to contribute to higher reliability, it has created a rubric that is more user friendly and valid. This study has preliminarily demonstrated that the rubric approach may be more appropriate for artifacts with more information, such as posters or reports, than for brief summaries, such as abstracts. In the posters, some trends based on competition variables were able to be identified. This constitutes the next step toward an implementable approach that has the potential to assess certain energy education endeavors.
Keywords: Energy Assessment, Energy Literacy, Scoring Rubric, Energy Competition
Introduction
This work advanced a previously developed approach of assessing energy literacy in a competition or course setting through a rubric-based evaluation of artifacts (Langfitt et al. 2014). That previous work found that a rubric-based approach was a viable option for assessing energy literacy, but that more work was needed to improve the instrument. The topic of this paper is the further work refining the rubric and scoring system, and improving rater preparation with the intent to make scoring more straightforward and reliable. Additionally, methodologies for this assessment process were refined in this second iteration to include interrater calibration and enhanced spreadsheet tools for scoring. The following sections outline background information on energy literacy, assessment practices, and the Imagine Tomorrow high school energy competition, on which the assessments were made.
Energy Literacy
Energy is necessary for most everyday functions, and increasing amounts of energy are needed to support modern development. Meeting the increasing demand for energy in a responsible and sustainable manner is a major challenge. To mitigate these concerns, it is important to advance energy generation and efficiency technologies, adapt conscientious energy policies that consider the many tradeoffs between different options, and be more aware of energy use on a personal level. The ability to accomplish these things is likely dependent partially on the energy literacy of the general population because people need to understand energy in order to effectively conserve as consumers and support the energy policies that meet their needs (DOE 2011, DOE 2013).
Energy literacy levels among U.S. adults has been assessed by various groups (NEETF 2002, Bittle et al. 2009, Southwell et al. 2012). The findings indicate that energy literacy levels are generally low. The National Environmental Education & Training Foundation (2002) found that only 12 percent of Americans could pass a basic energy quiz. Similarly, while Bittle et al. (2009) did not attach a passing grade mark, they found low energy literacy indicators such as that 52 percent of respondents believe that smog reduction “has gone a long way” in mitigating global warming, 51 percent of the respondents could not name a renewable energy source, and 65 percent think most of the United States’ oil imports come from the Middle East. A recent study, by Southwell et al. (2012), showed that over half of the respondents “essentially failed” their energy knowledge test, while 79 percent of those respondents believed that people like themselves could understand energy.
Energy knowledge is important to making good decisions about both energy policy and personal energy use (Turcotte et al. 2012, DOE 2011, DeWaters and Powers 2011). Studies have shown that different levels of energy knowledge and awareness affect how people act in terms of both policy decisions and personal energy usage (Hobman and Ashworth 2013, Buchanan et al. 2014, Abrahamse et al. 2005). Hobman and Ashworth (2013) found that providing some factual information about different energy sources affected surveyed people’s levels of support for different generation sources. Buchanan et al. (2014) and Abrahamse et al. (2005) found separately that people who received feedback on their energy use, such as through a smart meter, on average reduced their personal energy use due to greater transparency about how much energy they were using and how their habits impacted their energy use. These findings support the widely reported notion that people with more energy knowledge will be more informed to make better energy decisions.
It has been argued that this knowledge would be best learned in schools because “energy awareness” is mostly developed at a young age (Zografakis et al. 2008). Energy literacy levels are low among students as well, and have been for some time (Barrow and Morrisey 1989, Gambro and Switzky 1999, DeWaters and Powers 2011, Bodzin 2012), suggesting that current curriculums may not be effectively teaching holistic energy concepts. It may be beneficial to include more learning activities that encompass the full range of what constitutes energy literacy in school curriculums and extra-curricular activities. One of these teaching methods is project-based learning and Blumenfeld et al. (1991) argues that this avenue is particularly effective for certain types of learning because it requires practical application of concepts, which is one aspect of energy literacy.
Assessment of Energy Literacy
Given that energy literacy of the general population is important to a secure and sustainable energy future, diverse and effective tools are needed to assess energy literacy. While assessments alone do not improve energy literacy, they may aid in evaluating teaching methods of energy concepts. Most energy literacy studies assess knowledge through tests or questionnaires (NEETF 2002, Bittle et al. 2009, DeWaters and Powers 2011, Brewer et al. 2011, Southwell et al. 2012). That assessment avenue has the advantage of measuring knowledge on a wide range of energy topics, providing a controlled comparison between individuals, and allowing a pre/post learning activity experimental design.
Rubrics have been identified for and used in various contexts to measure knowledge gained based on a learning activity, such as project-based learning (Suskie 2009, Marínez et al. 2011, Thaler et al. 2009). Martínez et al. (2011) used a rubric approach to assess knowledge gained in the field of power supplies and photovoltaic electricity by evaluating the products of project-based learning activities in two undergraduate courses. Thaler et al. (2009) used a rubric to assess if student learning outcomes were achieved over the course of a research methods class culminating in a research paper. In the case of energy literacy, understanding is multifaceted (Southwell et al. 2012) and does not necessarily need to be based on a wide knowledge set, but rather can be based on knowledge gained during a specific activity that addresses a subset of energy knowledge and demonstrates critical thinking.
In some situations the testing approach may be difficult to implement and individual knowledge assessment may not be the goal. Sometimes the question is not ‘did they learn all of this?’ but rather, ‘did they learn something?’ This is the case in the Imagine Tomorrow competition where students are already immersed in extensive surveys on the competition experience and impacts on STEM, and the organizers and sponsors are more interested in energy literacy of teams as displayed in the deliverables, which might cover vastly different aspects of energy, than in the more broad, general energy literacy of the students. These were the original motivations for developing a rubric-based approach to assessing energy literacy of deliverables. Additionally, the Department of Energy (2011) has previously identified project-based and competition learning as avenues of focus for improving energy literacy, and rubric assessment of these deliverables might be a method to assess them since they might cover many different projects which focus on applied knowledge on a narrow topic, making a standard knowledge test not applicable. In addition, rubrics might allow for rating of past works and do not require those being assessed to put in any effort external to the project they have already completed. Finally, evaluation of energy literacy as displayed in artifacts may provide a more direct assessment path than testing. With the exception of the study which this work is advancing (Langfitt et al. 2014), we are unaware of rubrics being used for energy literacy. However, rubrics have been developed to assess literacy in science and sustainability, which are both related to energy (Tariq et al. 1998, Timmerman et al. 2011, McCormick et al. 2014).
Timmerman et al. (2011) developed a scientific reasoning rubric that focuses more on the correct application and presentation of an accurate scientific process than on specific science knowledge. This supports the notion that knowledge of specific details is not the only focal area of interest in scientific and related fields, and that demonstration of the process of problem solving and overarching ideas can be also be very important. Similarly, the goal of this paper’s process for the assessment of energy literacy is not to examine if students have addressed specific facts, but rather, to what degree they have examined the holistic nature of an energy issue. This appears to be the basis of a major guiding document in energy literacy developed by the U.S. Department of Energy (DOE) titled “Energy Literacy: Essential Principles and Fundamental Concepts for Energy Education” (2013). In this document, little focus is put on specific, temporally dependent information (like where the majority of U.S. oil imports are from), but rather the main focus is on the fact that energy is a multifaceted issue with social, economic, environmental, and other similar considerations, and also in basic scientific concepts about energy (such as most energy comes from the sun and that power is a measure of the rate of energy use). These types of ideas are intended to be the context in which energy literacy is defined for this study.
Imagine Tomorrow Competition
The Imagine Tomorrow competition is an annual high school energy competition which takes place at Washington State University in Pullman, WA. The competition is similar to a science fair, but focused on energy in particular. Teams consist of 3-5 students in grades 9-12 that come from Washington, Oregon, Idaho, and Montana. Each team is led by a mentor, typically a teacher at the students’ school, to guide the team through the process of completing a project. Students pose a research question related to an energy issue and complete a project to answer that question, in turn addressing some aspect of the larger energy issue. Each team chooses an entry challenge in which to compete from among the following options: Behavior, Biofuels, Design, and Technology. Mandatory deliverables include an abstract and a poster. Some students choose to complete additional deliverables such as a prototype or video. The teams and mentors attend the competition each May to present their projects and are judged by people from industry and academia and other interested members of the public.
The competition is somewhat unique in that the challenge structure allows projects to be focused not only on natural sciences, but also on social sciences and the arts. Particularly, the Behavior challenge (and to a lesser extent, the Design challenge) allows students to approach energy issues from a less technical, but equally important perspective. This challenge structure also encourages female participation with the Behavior challenge drawing many female participants. In fact, the competition consistently draws roughly equal numbers of male and female students.
Objectives
This paper is focused on improving a previous version of the energy literacy rubric developed by Langfitt et al. (2014) in an effort to increase validity of its use as an instrument to measure energy literacy, allow easier application, produce more consistent results, and then to apply it more comprehensively to the 2014 Imagine Tomorrow competition. The first objective of this study was to improve the rubric so that it could be used more readily by various raters, and be related to the aforementioned U.S. Department of Energy’s guiding document on energy literacy principles (2013). The second objective was to determine if revisions to the rubric and application process have resulted in greater agreement between raters on rating abstracts from the Imagine Tomorrow competition. The third was to determine if the rubric could be reliably applied to posters (only abstract rater reliability was examined in the previous study). The fourth objective was to confirm previously identified scoring trends through poster assessment and make further correlations between scores and data about teams, schools, competitors, etc. that could not be readily investigated in the previous study, but are now possible by additional data being provided this year, topical score breakdowns being recorded, and additional expertise gained by the data analyst. Some of these trends could serve to reveal factors that influence the effectiveness of Imagine Tomorrow in fostering energy literacy.
Methodology
Rubric Development and Use
The energy literacy rubric developed for this assessment was based on one developed for a previous assessment of Imagine Tomorrow deliverables (Langfitt et al. 2014). The content of the energy literacy rubric used for this study, shown in Table 1 (Langfitt and Haselbach 2014), was largely unchanged from the previous study, but the structure was significantly modified to make scoring quicker and easier, allow the assessment team to track performance for individual rubric topics, and reduce some of the subjectivity associated with deciding on an overall score. In addition, the content was related to the DOE principles of energy literacy (2013).
First, the content from the original rubric was organized into topics. These topics are listed in Table 1. In the modified rubric, within each topic, raters were then required to award 0, 1, 3, or 5 points to correlate roughly with literacy levels in the information provided in a competition artifact of absent, emerging, developing/competent, and effective/mastering, respectively, as deemed appropriate based on the listed criteria as shown in Table 1. An overall numerical score and word score were then automatically calculated for each deliverable based on the topic scores (numerical scores for data analysis and word scores for interrater reliability testing) using a spreadsheet approach. The numerical score was simply the arithmetic mean of the topic scores, and the word scores were assigned based on rounding the numerical scores up to the next whole number and assigning word scores as follows: 0-Absent, 1-Emerging, 2-Developing, 3-Competent, 4-Effective, and 5-Mastering. The rubric was designed to be general enough to apply to assessment of any project deliverable that addresses energy. This includes settings such as courses, extracurricular activities, and competitions.
| Points | ||||
| Topic | 0 | 1 | 3 | 5 |
| Issue | Notaddressed | Identify the issue | Frame the issue | Professionally frame the issue |
| Solution | Notaddressed | Identify solution tothe issue | Discuss a solution | Develop appropriate solution |
| Impacts | Notaddressed | Identify broaderImpacts | Discuss broader impacts | Examine broaderimpacts |
| Stakeholders | Notaddressed | Identify stakeholders | Consider stakeholderperspectives | Understand and addressstakeholder perspectives |
| Technical Concepts | Notaddressed | Identify technicalconcepts | Discuss technicalconcepts | Examine technicalconcepts as they relate to the project |
| Outside Information | Notaddressed | Identify basic info from outside sources or that this information exists | Discuss information from outside sources | Examine information as it relates to the project |
The DOE principles were then incorporated in the rubric application process to improve validity. Explicit inclusion of these principles as the guiding document to using the rubric was also intended to increase usability by those who may not have particular expertise with energy by providing the main information needed to judge basic energy literacy. Again, in this assessment, evaluation of the display of basic energy concepts and identification of various aspects of the holistic nature of an energy issue were the intended goals. The energy literacy assessment team mapped each sub-principle in the guide to be encompassed by one or two of the first five rubric topics, by their judgment (Langfitt and Haselbach 2014). No principles were mapped to Outside Information because that is not addressed in the energy literacy guide, however, it is included in the rubric because it is important for learning in a project setting. The raters then read through the principle-topic mapping and the energy literacy guide to gain an understanding of what types of concepts could be addressed to meet criteria in each rubric topic before starting the assessment. This mapping is provided in Table 2, with the numbers of the sub-principles associated with each rubric topic. For example, sub-principle 6.2, “One way to manage energy resources is through conservation”, was identified as a Solution. That is, if a deliverable suggests how to conserve energy, it is likely addressing a Solution.
| Rubric Topic | Underlying Energy Literacy Sub-Principles | |||||||||||
| Issue | 2.7 | 3.6 | 5.2 | 6.3 | 6.4 | 6.7 | 7.1 | 7.2 | 7.3 | 7.4 | 7.5 | 7.6 |
| Solution | 4.1 | 4.5 | 4.5 | 4.6 | 5.3 | 6.2 | 6.5 | 6.6 | 6.8 | |||
| Impacts | 2.3 | 2.4 | 2.6 | 3.5 | 4.7 | 5.4 | 5.6 | 7.1 | 7.2 | 7.3 | ||
| Stakeholders | 4.2 | 5.1 | 5.5 | 5.7 | 7.4 | 7.5 | 7.6 | |||||
| Technical Concepts | 1.1 | 1.2 | 1.3 | 1.4 | 1.5 | 1.6 | 1.7 | 1.8 | 2.1 | 2.2 | ||
| 2.5 | 3.1 | 3.2 | 3.3 | 3.4 | 4.1 | 4.3 | 4.4 | 4.5 | 6.1 | |||
Note: these sub-principles numbers align with DOE principles in the Version 2.0 document
Application to the Imagine Tomorrow Competition
Imagine Tomorrow deliverables were evaluated as an assessment of the rubric approach and an investigation into scoring trends. It was also intended as an example of how the rubric can be applied. Three raters scored every abstract from the 2014 Imagine Tomorrow competition for energy literacy as assessed by inclusion of related information in the artifact, and Raters 1 and 3 scored every poster (Rater 1 is a PhD student in civil and environmental engineering, Rater 2 is a faculty member with a PhD in education with focuses on sustainability and natural resource conservation, and Rater 3 is an upper level undergraduate in civil and environmental engineering.) The abstracts were rated so that reliability statistics from the previous study could be compared to this study to determine if changes to the rubric and application methodology increased rubric reliability. The posters were rated to examine how reliably the rubric could be applied to this type of deliverable, and to identify trends linked to competition variables. In both cases, the number of raters for each artifact was increased by one from the previous study as an initial investigation into rater variability.
Calibration
Rater calibration is an important component of rubric scoring that has been shown to significantly increase interrater reliability (Rhodes and Finley 2013). Calibration is the process of equilibrating raters on rubric and scoring interpretation. Generally, it is accomplished by each rater scoring the same selection of works and then discussing any differences in ratings until a relatively consistent understanding of how to apply the rubric has been reached among all raters. In this study, calibration was done on the abstracts only. Twenty abstracts from a previous Imagine Tomorrow competition which were representative of the general range of quality (by Rater 1’s opinion) were chosen and sent to each of the three raters (for other applications, a representative sample from the current data set might be used instead).
The raters each scored these same twenty abstracts and discussed scoring inconsistencies over a conference call to attempt to resolve any differences. Following that discussion, the raters re-scored four of the abstracts and discussed the scores. This final activity produced much more similar results than the initial scoring suggesting that the calibration session did contribute to a mutual understanding of how to apply the rubric. It should also be noted that no posters were scored in this calibration session due to time constraints.
Data Collection
Registration for Imagine Tomorrow occurs in the spring for that summer’s competition. At the time of registration each team submitted information about their project including a title, a research question and methodology (collectively referred to as the “abstract”), the competition challenge they would like to compete in, and whether the project was done as an extracurricular or in-class activity. In total, the information represented in the ‘abstract’ artifacts range between 50-200 words. They also provided detailed information about the team members including name, gender, and grade, and information about the team’s advisor including name, school, and primary subject taught.
Raters 1 and 2 attended the Imagine Tomorrow competition on May 31, 2014. A photographer took pictures of every poster to be used as the official artifact in subsequent rating of the posters, and Rater 1 also took pictures of the posters for backup in case any posters were missing or not clearly visible in the official set. Additionally, Rater 1 took pictures of ancillary materials such as models and chemistry setups. No students are visible in any of the photographs to eliminate any associated bias. The posters were then used in analyzing the following variables for trends related to energy literacy:
- Gender
- Repeat Student Participants
- Repeat School Participation
- Repeat Advisor Participation
- Entry Challenge
- Rubric Topic
- Average Student Grade Range
- Project Setting (class or extracurricular)
- Advisor Teaching Subject
Reliability Assessment
Interrater reliability refers to the level of agreement between multiple raters when rating the same works (Moskal and Leydens 2000). Measuring interrater reliability is an important step in rubric development to demonstrate that the rubric can be applied similarly by different raters. Consensus and consistency are two types of interrater reliability. If raters exhibit high consensus, they have generally agreed on what score each artifact should receive. On the other hand, to achieve high consistency, the raters must generally agree on which works deserve higher scores than others, but not on the magnitude of those scores (i.e. rank the works in the same order) (Stemler 2004). While consensus in scoring is preferred, consistency can serve to reveal the same trends and in many cases be nearly as effective in accomplishing the goals of a rubric assessment.
Consensus was measured with Conger’s Kappa (Conger 1980). A Kappa of one (1) represents perfect agreement, zero (0) represents no more agreement than would be expected by chance, and negative one (-1) represents perfect disagreement. Intermediate interpretation depends on the specific situation, but general agreement scales have been developed (Landis and Koch 1977, Fleiss 1981, Altman 1991) that are widely used and generally accepted given a large enough sample size (Gwet 2012). Consistency between two raters was measured by Spearman’s correlation coefficient and between three raters with Kendall’s Coefficient of Concordance (Spearman 1904, Kendall and Smith 1939). At least one general interpretation scale was proposed by Cohen (1988).
Results
User Friendliness and Validity
There were no specific instruments used to determine if the modified rubric was more user friendly than the original version. In fact, one of the three raters did not participate in the previous study on the 2013 competition. However, the modified format allowed for rapid conversion of scoring to both quantitative and qualitative scores, and for more detailed information availability (such as which topics were ranked higher or lower for a team), without any additional effort by the raters.
While there were no specific tests performed for rubric validity, the incorporation of the DOE’s principles of energy literacy (2013) into the assessment process by the cross-referenced matrix in the topical areas provides justification for validity. This is particularly true since these principles have been vetted by numerous federal and other agencies. Therefore, the requirement for raters to read and factor these principles into the assessment process provides a shared set of accurate knowledge from which to judge energy literacy.
Reliability
Rubric reliability testing found that the raters exhibited slight consensus and medium consistency for energy literacy scores on the abstract assessment. Poster reliability statistics showed slight consensus and high consistency. These results, along with the results of the abstract assessment in the previous study (Langfitt et al. 2014) are summarized in Table 3.
| Previous Abstracts | Previous Abstract Agreement | Current Abstracts |
Current Abstract Agreement | Current Posters | Current Poster Agreement | |
| Consensus | κc=0.093 | Slight* | κc=0.091 | Slight* | κc=0.183 | Slight* |
| Consistency | ρ=0.552 | High** | W=0.436 | Medium** | ρ=0.818 | High** |
Note: κc is Conger’s Kappa, W is Kendall’s Coefficient of Concordance, and ρ is Spearman’s Rank Correlation Coefficient.
*Based on Landis and Koch 1977
**Based on Cohen 1988
The current version of the rubric produced slightly poorer abstract reliability results than the previous version. This seems to indicate that the changes made to the rubric did not result in reliability improvements. However, these are not the only reliability measures that exist, and it is difficult to be sure that they are the best indicators in this particular situation. For example, another common way to measure consensus is simple percent agreement between the raters which increased from 18% in the previous study to 52% in this study.
Reliability on the poster assessment was significantly better than the abstract assessment, particularly with respect to consistency. The high consistency and improved consensus indicate the rubric approach may be more applicable to the posters than to the abstracts. This is logical because the posters are produced after the abstracts and are not as limited in scope, allowing teams to develop and demonstrate more varying levels of energy literacy, which may be more easily reflected in the ratings. However, since there were only two raters for the posters, this might have influenced the level of agreement over that obtained with more raters. Research employing additional raters may be warranted on the poster evaluations for future competitions.
Variable-Linked Trends in Poster Assessment
The poster assessment was used to examine how variables related to the school, advisor, team composition, challenge entered, and other factors may be linked to scores. Table 4 includes results for all analyzed variables. The Kruskal-Wallis Test was used to determine p-values since it is designed to detect differences in non-parametric data. The critical p-value is considered to be 0.05 (that is, a p-value less than 0.05 represents statistical significance). Note that for the variable Gender, the term ‘mostly’ in front of female and male indicates that at least 75% of the participants on that team were of that gender.
| Rater 1 | Rater 3 | ||||
| Variable | Comparison | Avg. Score | p-value | Avg. Score | p-value |
| Gender | Mostly Female | 1.54 | 0.118 | 1.45 | 0.277 |
| Mixed | 1.18 | 1.25 | |||
| Mostly Male | 1.66 | 1.64 | |||
| Repeat Student Participants | All New | 1.48 | 0.627 | 1.36 | 0.137 |
| 1-59% Repeat | 1.28 | 1.39 | |||
| > 60% Repeat | 1.73 | 1.91 | |||
| Entry Challenge | Behavior | 1.11 | 0.028* | 0.98 | <0.001* |
| Biofuels | 1.84 | 1.52 | |||
| Design | 1.30 | 1.65 | |||
| Technology | 1.71 | 1.72 | |||
| Rubric Topic | Issue | 1.83 | <0.001* | 1.20 | <0.001* |
| Solution | 2.19 | 1.11 | |||
| Impacts | 1.11 | 1.32 | |||
| Stakeholders | 1.22 | 1.79 | |||
| Technical Concepts | 1.20 | 1.53 | |||
| Outside Information | 1.35 | 1.82 | |||
| Average Student Grade Range | 9-9.9 | 1.16 | 0.031* | 1.25 | 0.092 |
| 10-11 | 1.73 | 1.59 | |||
| 11.1-12 | 1.29 | 1.38 | |||
| Project Setting | Class | 1.63 | 0.254 | 1.33 | 0.315 |
| Extracurricular | 1.40 | 1.51 | |||
| Advisor Teaching Subject | STEM | 1.50 | 0.899 | 1.54 | 0.194 |
| Not STEM | 1.44 | 1.32 | |||
| Repeat School Participation | Repeat School | 1.48 | 0.807 | 1.45 | 0.810 |
| New School | 1.43 | 1.44 | |||
| Repeat Advisor Participation | Repeat Advisor | 1.54 | 0.210 | 1.49 | 0.462 |
| New Advisor | 1.33 | 1.36 | |||
* Statistically significant based on p < 0.05
Statistically significant differences among comparisons were detected for three variables for Rater 1 (Entry Challenge, Rubric Topic, Average Student Grade Range) and two variables for Rater 3 (Entry Challenge, Rubric Topic). This is detailed more in the following paragraphs for these three variables.
For the Entry Challenge variable, both raters awarded lower average scores to teams in the Behavior challenge. This is consistent with previous results where it was hypothesized that Behavior projects are more reliant on social concepts related to energy, which may not be included as much in the DOE’s principles of energy literacy, nor in the topics chosen for the rubric (Langfitt et al. 2014). Additionally, more Behavior projects failed to make direct links to energy, rather addressing sustainability issues in isolation, which contributed to a lower average score. If one examines the average score given by each rater to each Entry Challenge, they trend differently, with consensus on the Behavior and Technology challenges, but different interpretations in the Biofuels and Design challenges.
Statistical differences between Rubric Topics were present for both raters. Rater 1 awarded the most points for Solution and Issue, while Rater 2 awarded the most points for Outside Information and Stakeholders. However, overall scoring consistency was high, so perhaps the same amount of energy literate information was being acknowledged, but categorization of that information differed between the raters. If identifying overall scoring trends is the goal of the assessment, this may not be a significant issue. More clarity in the rubric (in the form of longer explanations of criteria) and a more lengthy calibration session may have reduced this categorization issue. In addition, when the DOE’s principles of energy literacy (2013) were cross-referenced to each Rubric Topic as shown in Table 2, there were several that fell into two topic categories (the number of topic categories was limited to two for the cross-referencing, although one might arguably use more). Therefore, scoring consistency among Rubric Topics may also have been influenced by this variability.
Both raters demonstrated the same trend in average scores based on Average Student Grade Range in which teams comprised of mostly freshmen scored poorest, followed by mostly seniors, and teams mostly made of middle grades scored highest. This is consistent with previous results and it is hypothesized that, in general, freshmen may not have developed as much energy knowledge as older students, and seniors may be more involved with other responsibilities such as applying to college, scholarships, and finishing up their work to graduate to spend as much time on the competition as their younger peers (Langfitt et al. 2014).
There may be some other slight trends, although they are not statistically significant. Therefore, the following additional interpretation of the results is presented with the acknowledgement that the Kruskal-Wallis Test did not detect significant differences at α=0.05.
- With respect to Gender, it appears that teams composed of mostly males performed only slightly better than teams composed of mostly females, and teams composed of a nearly even mix scored lowest on average. This statistical comparison has not been modified for the effects of Challenge on the scores, which would probably result in an even closer, if not reversed trend.
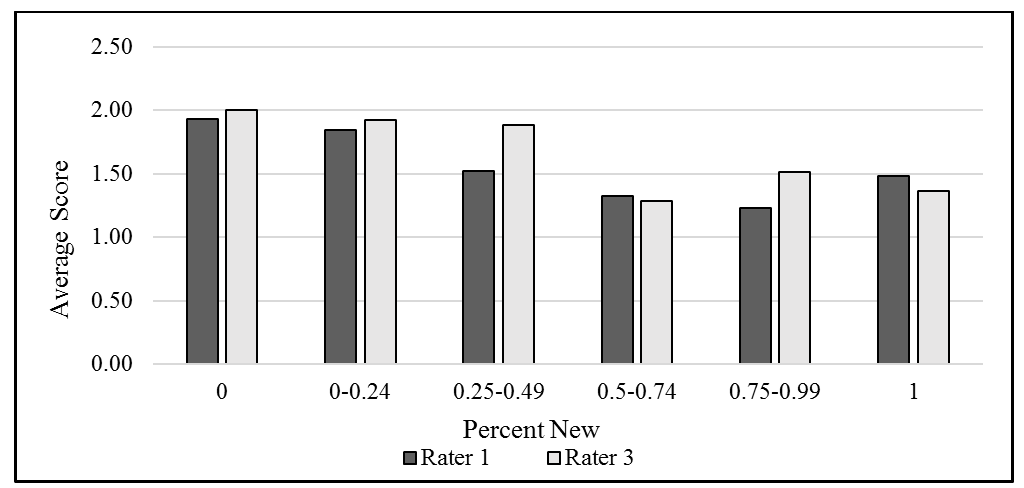
- Teams made of up mostly Repeat Student Participants scored slightly higher than those made up of mostly new participants (Figure 1 demonstrates the consistency of this trend visually, even though statistical significance was not detected). This implies that students are likely gaining energy knowledge at previous competitions that can be observed in the subsequent year’s posters.
- With respect to Advisor Teaching Subject, teams led by advisors whose main teaching subject is in a STEM field seemed to produce only slightly higher average scores than those in non-STEM. The same appears to be true for new versus previously competing advisors, where Repeat Advisor Participation appeared to be only slightly more effective. These results suggest that any advisor can be effective, regardless of background and competition experience.

Figure 1: New versus repeat student participation (based on percentage of students on team who had previously competed in Imagine Tomorrow).
No consistent trend appears with respect to class and extracurricular project settings (Project Setting). Also, there does not appear to be a correlation between score and whether the school was returning or new to the competition (Repeat School Participation).
Limitations
Despite improvements made to the rubric and application process, this research should be viewed as preliminary since it still harbors some limitations. Most notably, the reliability results, while strong for consistency, were quite weak for consensus. This limitation might be addressed in future work with a more rigorous calibration session and possibly the addition of further criteria definition and/or examples for the rubric. As for the assessment of reliability, only one measure was used for consensus and two for consistency (one for two rater and one for more than two raters), while many measures exist and these other measures may have strengthened the interpretation of the results. Another limitation was that only two raters were included for the poster ratings (although this was an increase over the previous paper’s one rater for posters). Determining a minimum number of raters needed for improved reliability is currently under consideration for future research. In addition, it should be noted that the rubric is based on the raters applying the DOE principles of energy literacy, and since the various raters may have more or less knowledge in energy technology, there may be variability or even error in their interpretations. Future studies on rater variability might be considered, but the intention herein is that the tool may be used by raters of varying energy and other knowledge.
Conclusion
Based on the utilized reliability statistics, there were fairly high levels of consistency between the raters for both the abstracts and the posters. The modifications did not improve the abstract rating reliability, but it was still fairly high considering the relatively small amount of material to be scored. It was found that application to the posters was considerably more reliable than application to the abstracts, suggesting that the rubric assessment may be more appropriate for a more detailed deliverable that has a greater amount of content than that found in an abstract, although there may be a need for additional raters to verify this.
There were no quantitative analyses performed for user friendliness or validity. However, the modified format led to rapid interpretation of the results even though it included more independent variables such as Rubric Topics, which aided in the assessment. Improved validity with respect to its application as an energy literacy instrument is implied by incorporation of the DOE energy literacy principles. This might also be suggested by the higher scores from repeat participation of the students, although it cannot be stated whether this is solely due to participation in the competition, or other factors such as increased learning at school.
Similar variable-linked trends identified in the poster assessment of the 2014 competition to the abstract assessment of the 2013 competition (Langfitt et al. 2014) further support variable-linked findings, which in turn implies that this assessment approach may be effective for evaluating some of the variables of the competition. Further evaluation is warranted if there is a desire to improve consensus. The work done for this study does appear to constitute a preliminary step towards an improved rubric, enhanced application methodology and a better understanding of where this instrument may or may not be used effectively.
Acknowledgements
The authors would like to thank the Ecoworks Foundation, the Bank of America, Boeing, the Center for Environmentally Sustainable Transportation in Cold Climates (CESTiCC), and the many other sponsors of the Imagine Tomorrow Competition for their generous support. The authors gratefully acknowledge the Northwest Advanced Renewables Alliance supported by the Agriculture and Food Research Initiative Competitive Grant no. 2011-68005-30416 from the USDA National Institute of Food and Agriculture, for funding part of this work. Appreciation is also for other members of the Imagine Tomorrow Competition steering committee. Additionally, we would like to thank Brandon Werner for his contribution as a rater.
References
Abrahamse, W., Steg, L., Vlek, C., and Rothengatter, T. (2005). “A review of intervention studies aimed a household energy conservation.” Journal of Environmental Psychology, 25(3), 273–291.
Altman, D.G. (1991). Practical Statistics for Medical Research, Chapman & Hall, London, UK.
Barrow, L., and Morrisey, T. (1989). “Energy literacy of ninth-grade students: A comparison between Maine and New Brunswick.” Journal of Environmental Education, 20(2), 22–25.
Bittle, S., Rochkind, J., and Ott, A. (2009). “The energy learning curve.” <www.publicagenda.org/reports/energyS> (Jun. 24, 2014).
Blumenfeld, P. C., Soloway, E., Marx, R. W., Krajcik, J. S., Guzdial, M., and Palincsar, A. (1991). “Motivating Project-Based Learning: Sustaining the Doing, Supporting the Learning.” Educational Psychologist, 26(3/4), 369–398.
Bodzin, A. (2012). “Investigating urban eighth-grade students’ knowledge of energy resources.” International Journal of Science. Education, 34(8), 1255–1275.
Brewer, R. S., Lee, G. E., and Johnson, P. M. (2011). “The Kukui Cup: A dorm energy competition focused on sustainable behavior change and energy literacy.” Proc., Hawaii International Conference on System Sciences, Univ. of Hawaii at Manoa, Honolulu, HI, 1–10.
Buchanan, K., Russo, R., and Anderson, B. (2014). “Feeding back about eco-feedback: How do consumers use and respond to energy monitors?” Energy Policy, 73, 138-146.
Cohen, J. (1988). “The significance of a product moment rs.” Statistical Power Analysis for the Behavioral Sciences, L. Erlbaum Associates, Hillsdale, NJ, 75–107.
Conger, A.J. (1980). “Integration and Generalization of Kappas for Multiple Raters.” Psychological Bulletin, 88(2), 322-328.
Department of Energy (DOE). (2011). “Strategic Plan.” U.S. Department of Energy.
DeWaters, J. E., and Powers, S. E. (2011). “Energy literacy of secondary students in New York State (USA): A measure of knowledge, affect, and behavior.” Energy Policy, 39(3), 1699–1710.
Department of Energy (DOE). (2013). “Energy Literacy: Essential Principles and Fundamental Concepts for Energy Education Version 2.0.” U.S. Department of Energy.
Fleiss, J.L. (1981). Statistical Methods for Rates and Proportions, John Wiley & Sons,
Gambro, J., and Switzky, H. (1999). “Variables associated with American high school students’ knowledge of environmental issues related to energy and pollution.” Journal of Environmental Education, 30(2), 15–22.
Gwet, K.L. (2012). Handbook of Inter-Rater Reliability: The Definitive Guide to Measuring the Extent of Agreement Among Raters, Advanced Analytics, LLC, Gaithersburg, MD.
Hobman, E. V., and Ashworth, P. (2013). “Public support for energy sources and related technologies: The impact of simple information provision.” Energy Policy, 63, 862–869.
Kendall, M.G., and Smith, B.B. (1939). “The Problem of m Rankings.” The Annals of Mathematical Statistics, 10(3), 275-287.
Landis, J. R., and Koch, G. G. (1977). “The measurement of observer agreement for categorical data.” Biometrics, 33(1), 159–174.
Langfitt, Q. and Haselbach, L. (2014). “Imagine Tomorrow High School Energy Competition 2014: Energy Literacy and Biofuels Literacy Assessment of Abstracts and Posters”, Report to the Imagine Tomorrow Steering Committee, Washington State University, Sept. 2014.
Langfitt, Q., Haselbach, L., and Hougham, R.J. (2014). “Artifact-Based Energy Literacy Assessment Utilizing Rubric Scoring.” ASCE Journal of Professional Issues in Engineering Education and Practice, 10.1061/(ASCE)EI.1943-5541.0000210, C5014002.
Martínez, F., Herrero L.C., de Pablo, S. (2011). “Project-Based Learning and Rubrics in the Teaching of Power Supplies and Photovoltaic Electricity.” IEEE Transactions on Education, 54(1), 87-96.
McCormick, M., Lawyer, K., Wiggins, J., Swan, C.W., Paterson, K.G., and Bielefeldt, A.R. (2014). “Sustainable Engineering Assessment Using Rubric-Based Analysis of Challenge Question Responses.” ASCE Journal of Professional Issues in Engineering Education and Practice, 10.1061/(ASCE)EI.1943-5541.0000211, C4014002.
Moskal, B. M., and Leydens, J. A. (2000). “Scoring rubric development: Validity and reliability.” Practical Assessment, Research & Evaluation., 7(10), 1–11, 〈http://PAREonline.net/getvn.asp?v=7&n=10〉 (Oct. 16, 2013).
Rhodes, T., and Finley, A. (2013). “Rubric calibration.” Using the VALUE rubrics for improvement of learning and authentic assessment, Association of American Colleges and Universities, Washington, DC, 23–25.
Southwell, B. G., Murphy, J. J., DeWaters, J. E., & LeBaron, P. A. (2012). “Americans’ perceived and actual understanding of energy.” (RTI Press peer-reviewed publication No. RR-0018-1208). Research Triangle Park, NC: RTI Press.
Spearman, C. (1904). “The Proof and Measurement of Association between Two Things.” The American Journal of Psychology, 15(1), 72-101.
Stemler, S. E. (2004). “A comparison of consensus, consistency, and measurement approaches to estimating interrater reliability.” Practical Assessment, Research & Evaluation, 9(4), 1–19.
Suskie, L. (2009). Assessing student learning: A common sense guide. Jossey-Bass, San Francisco, CA.
Tariq, V. N., Stefani, L. A. J., Butcher, A. C., and Heylings, D. J. A. (1998). “Developing a new approach to the assessment of project work.” Assessment & Evaluation in Higher Education, 23(3), 221–240.
Thaler, N., Kazemi, E., Huscher, C. (2009). “Developing a Rubric to Assess Student Learning Outcomes Using a Class Assignment.” Teaching of Psychology, 36, 113-116.
The National Environmental Education & Training Foundation (NEETF). (2002). “Americans low ‘Energy IQ:’ A risk to our energy future.” 〈http://www.neefusa.org/pdf/roper/Roper2002.pdf〉 (Jun. 24, 2014).
Timmerman, B. E. C., Strickland, D. C., Johnson, R. L., and Payne, J. R. (2011). “Development of a ‘universal’ rubric for assessing undergraduates’ scientific reasoning skills using scientific writing.” Assessment & Evaluation in Higher Education, 36(5), 509–547.
Turcotte, A., Moore, M. C., and Winter, J. (2012). “Energy Literacy in Canada.” University of Calgary. The School of Public Policy. <http://www.eisourcebook.org/cms/Canada,%20Energy%20Literacy.pdf> (June 24, 2014).
Zografakis, N., Menegaki, A. N., and Tsagarakis, K. P. (2008). “Effective education for energy efficiency.” Energy Policy, 36, 3226–3232.


 Quinn Langfitt is a PhD student in the School of Civil and Environmental Engineering at Washington State University. His research is mostly focused on sustainability, including work on life cycle assessment and energy literacy assessment. quinn.langfitt@email.wsu.edu
  Liv Haselbach is an associate professor in the School of Civil and Environmental Engineering at Washington State University. She is also the author of The Engineering Guide to LEED-New Construction: Sustainable Construction for Engineers. haselbach@wsu.edu
  R. Justin Hougham is assistant professor at the University of Wisconsin- Extension and Director of Upham Woods Outdoor Learning Center where he supports the delivery of a wide range of science education topics to K-12 students, graduate students, and in-service teachers. Justin’s scholarship is in the areas of place-based pedagogies, STEM education, and education for sustainability.
Justin.hougham@ces.uwex.edu
R. Justin Hougham is assistant professor at the University of Wisconsin- Extension and Director of Upham Woods Outdoor Learning Center where he supports the delivery of a wide range of science education topics to K-12 students, graduate students, and in-service teachers. Justin’s scholarship is in the areas of place-based pedagogies, STEM education, and education for sustainability.
Justin.hougham@ces.uwex.edu