


A Sustainability Performance Assessment Tool: The SPA System
 Link to Deepening Our Craft February 2017 JSE TOC
Paun et al JSE Feb 2017 Gen Issue PDF
Abstract: Stakeholders have become increasingly vocal about companies’ sustainability impacts, and corporations have responded by issuing sustainability reports that discuss and gauge performance metrics for a variety of social and environmental dimensions. These corporate sustainability reports are public domain and contain a wealth of longitudinal data that could be used by stakeholders, including educators and students. However, these reports appear to be vastly underutilized due to insufficient knowledge of and skills for assessing corporate sustainability information. This article presents the SPA (Sustainability Performance Assessment) System (Paun 2015), an educational tool for mentoring students in corporate sustainability performance research. The Global Reporting Initiative’s (GRI) G4 framework forms the model underlying SPA. A student learning outcomes survey reported that 96% of the respondents said the SPA System reduced sustainability report complexity through enhancing their sustainability knowledge and/or analytical skills. More specifically, student feedback indicated an increased understanding of sustainability both as a concept and from a business perspective, and the improved ability to assess and compare corporate sustainability performance based on sustainability report information and data.
Keywords: sustainability, sustainability report, sustainability education, sustainability reporting, corporate social responsibility, CSR, research mentoring, stakeholders
SPA: A SUSTAINABILITY PERFORMANCE ASSESSMENT EDUCATIONAL TOOL
PROBLEM, GOALS, AND JUSTIFICATION
According to Dyllick and Hockerts (2002), corporate sustainability is, “meeting the needs of the firm’s stakeholders without compromising its ability to meet future stakeholder needs.” Over the past 20 years, stakeholders have become increasingly vocal about companies’ sustainability impacts. Corporations have responded by increasing transparency through issuing sustainability reports (also known as corporate social responsibility, CSR, citizenship, and environmental reports) that discuss and provide performance metrics for a variety of social and environmental dimensions. Sustainability reports provide extensive longitudinal data and are available to the public (reports can be downloaded from corporate websites). Watts (2015a, 2015b) discusses how sustainability reports have created very large quantities of data that can be stored and analyzed by all stakeholders.
The Governance & Accountability Institute (2014) says that sustainability reporting has become a mainstream practice in the U.S., with 75% of the S&P 500 companies issuing a sustainability report. A KPMG (2013) report, which refers to sustainability reporting as “undeniably a mainstream business practice worldwide,” found that 71% of the 4,100 global companies it surveyed as well as 93% of the world’s largest 250 companies issue sustainability reports.
So, what is the “problem?” Sustainability reports are vastly underutilized due to their complexity. Watts (2015a) believes that complexity arises because effective use of sustainability reports requires an in-depth understanding of diverse topics like ecosystem services, community involvement, and corruption laws. Bartel, Iansen, and Kuszewski (2008) conducted a survey of sustainability report users and reported that respondents found it challenging to extrapolate data from reports, which may be due to the lack of an established means of assessing sustainability information.
Watts further discusses the need for increasing the ability of consumers to use sustainability report information through education. Herremans, Nazari, and Mahmoudian (2015) call for future efforts that increase stakeholder (e.g., students) engagement in sustainability reporting. Bartel et al. call for further communication and development work for those who “would change their [sustainability report use] behavior if they had a better understanding of the wider concept of sustainability reporting.” Further, they believe that people who have never read sustainability reports can be transformed into report users via improved explanations of sustainability performance.
Obermiller and Atwood (2014) say that while many believe teaching sustainability is important, little attention has been paid to the adequacy of faculty for teaching sustainability literacy. The first author (Paun) of this article has taught and researched sustainability reporting for the past decade, and her goal has been to create, pilot test, refine, and use in multiple contexts a teaching tool called SPA (Sustainability Performance Assessment). SPA is designed for mentoring students in sustainability research as a means of lowering the complexity barrier, communicating the value of sustainability reports, and increasing sustainability literacy.
MODEL
Global Reporting Initiative (GRI) Framework for Sustainability Reporting
Based on an extensive survey, KPMG (2013) claimed, “the use of Global Reporting Initiative (GRI) guidelines is almost universal.” GRI provides principles, widely accepted rules and procedures for reporting environmental, social, and economic performance that can be likened to GAAP for financial performance reporting. Without GRI guidelines, companies would be at liberty to withhold environmental and social information that might adversely affect investors and other stakeholders. Sustainability performance disclosed in accordance with GRI guidelines provides consistency for those who use sustainability reports to assess a company’s sustainability performance over time (intra-firm comparison), or in comparison to competitors (inter-firm comparison)
The latest Global Reporting Initiative framework, called G4, was released in 2014. The framework provides pillars of sustainability reporting supplemented with guidelines for Standard Disclosures about a company’s 1) profile (not the focus of the SPA sustainability performance-based tool and this article) and 2) methods and metrics for 91 sustainability performance indicators. GRI offers two publications that provide information about principles for sustainability report content (Table 1) and indicators of sustainability performance (Table 2). First, the GRI Reporting Principles and Standard Disclosures publication contains reporting principles, standard disclosures, and the criteria to be applied by an organization to prepare its sustainability report. Second, the GRI Implementation Manual explains how to apply the reporting principles, how to prepare the information to be disclosed, and how to interpret the sustainability performance concepts. Hereafter, this second publication will be referred to simply as the GRI Manual. As will be explained later in this article, the GRI Manual is a required reading for students who are mentored in sustainability report research.
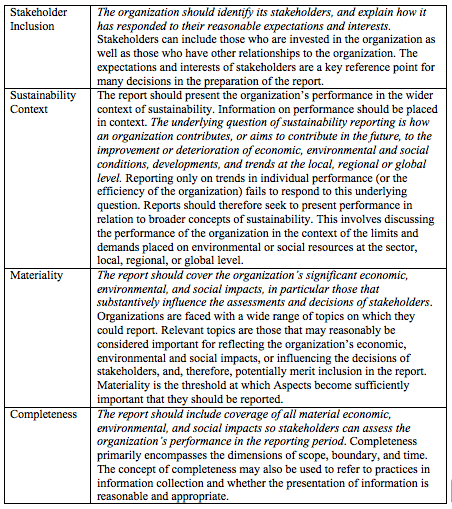
Table 1: Summary of GRI Principles of Sustainability Report Content
Table 2 (below) presents a list of GRI’s three sustainability indicator categories (economic, environment, and social) and four social sub-categories within the social category (human rights, labor practices, product responsibility, and society) for measuring and reporting sustainability impacts and performance. Below is additional information about these indicator categories and sub-categories.
- The ECONOMIC category covers impacts on the economic conditions of stakeholders and throughout society (local, regional, national, global) and not financial performance. The economic information compliments financial reporting efforts but data is a result of sustainability-related metrics. There are nine economic indicators (EC1-EC9), and detailed information about these indicators is in the GRI Manual on pages 67-83. Examples of economic indicators are:
- EC2 Financial Implications and Risks and Opportunities Due to Climate Change
- EC5 Ratios of Entry Level Wage by Gender
- EC9 Proportion of Spending On Local Suppliers
- The ENVIRONMENT category focuses on impacts on living and non-living natural systems, including land, air, water and ecosystems. There are 34 environment indicators (EN1-EN34), and detailed information about these indicators is in the GRI Manual on pages 84-141. The environment indicators cover inputs (e.g., energy, water, and materials used), outputs (e.g., emissions, effluents, waste), biodiversity, transport, products, supplier environmental assessment, environmental compliance, grievances, and expenditures. Example of environment indicators are:
- EN2 Percentage of Recycled Materials Used
- EN3 Energy Consumption
- EN15 Direct Greenhouse Gas Emissions
- EN22 Water Discharged by Quality and Destination
- EN30 Environmental Impacts of Transporting Products and Transporting Members of the Workforce
- EN33 Potential Negative Environmental Impacts in the Supply Chain and Actions Taken
- The SOCIAL category addresses impacts on the social systems within which an organization operates and includes four sub-categories. There are 48 social indicators (HR1-HR12, LA1-LA16, PR1-PR9, SO1-SO11), and detailed information about these indicators is in the GRI Manual on pages 142-235. The HUMAN RIGHTS sub-category covers the extent to which processes have been implemented, changes in stakeholders’ ability to enjoy and exercise their human rights, and incidents of human rights violations (e.g., child labor, forced or compulsory labor). The LABOR PRACTICES AND DECENT WORK sub-category is concerned with employee health and safety, diversity and equal opportunity, discrimination, right to organize and collective bargaining, and equal remuneration. The PRODUCT RESPONSIBILITY sub-category focuses on products and services that directly affect stakeholders, and customers in particular. The SOCIETY sub-category covers impacts that an organization has on society and local communities. Examples of social indicators are:
- Human Rights: HR2 Employee Training on Human Rights Policies and Procedures
- Labor Practices and Decent Work: LA13 Ratio of Salary and Remuneration of Women to Men
- Product Responsibility: PR8 Breaches of Customer Privacy and Losses of Customer Data
- Society: SO10 Negative Impacts on Society in the Supply Chain
Note that the scope of this article is the GRI social indicators (not environment and economic indicators).

Table 2: Summary of GRI Sustainability Performance Categories and Social Sub-Categories (Pasted from the GRI Implementation Manual)
The GRI G4 framework forms the model underlying the SPA tool for mentoring students in sustainability performance research.
METHOD
SPA System Overview
The first author created the SPA System (Sustainability Performance Assessment) in order to provide students with an easy to use methodology for assessing real world sustainability performance using corporate sustainability reports. There are student and instructor dimensions to using the SPA System. This article explains the student SPA tool, based on an Excel file called the SPA Data file. A subsequent article will explain how to mentor students in the SPA process. Educators are invited to use Paun’s SPA teaching tool (called the SPA Data file) and can email (dap@uw.edu) requests for the SPA Data file (must secure use permission and acknowledge the copyright holder) (Paun 2015).
SPA Data File
Students use the SPA Data file to assess sustainability performance for the GRI indicators associated with each course module for the assigned case study companies using their respective most recently published sustainability reports. The first author’s courses use three case study companies, which change each time the course is taught. For this article, CSX, Fluor, and UPS are the selected case study companies.
The SPA Data file contains three worksheets: 1) SPA Data worksheet, 2) Assessing 4 Versus 5 Points worksheet, and 3) Report Errors & Omissions worksheet. Below is information that describes each worksheet as well as a screenshot of each worksheet in the SPA Data file.
1) SPA Data Worksheet
This worksheet is where students enter their assessment points for the GRI indicators. As shown in Figure 1a, rows 1-10 in this SPA Data worksheet describe the sustainability assessment process, including a key to assessing points. Below the assessment summary are rows for each GRI indicator (the indicator label, like HR1, and a brief description of that indicator). In Figure 1, HR 1 is in row 106-107 (rows 13-102 contain the economic and environment indicators which are not in the scope of this article that focuses on the GRI social indicators). To the right of the indicator description columns, lie two columns designated to each company for each indicator. Each company is given a column titled “Report Page #” and another column titled “Your points.” In the “Report Page #” cell, students insert the page(s) listed in the company’s sustainability report GRI Index (more info in the Syllabus section below) for reference throughout the assessing process. For example, in Figure 1 Column N, Row 106, is labelled “CSX: Report Page #.” This is where a student inserts the pages that CSX discloses information for HR1. Column O, the next column over, in Row 106, is “CSX: Your Points”. After a student has read these report pages containing HR1 info, then they assess 0-5 points using the key to assigning points in Rows 5-10. Columns R and S, in Row 106, are for entering Fluor’s page numbers and assessed points, and Columns V and W are for UPS. As shown in Figure 1b, the bottom rows (Row 226 onward) in the SPA Data worksheet provide summary statistics, which are automatically calculated each time assessed points are entered. Summary statistics for the Labor Practices indicators are shown for illustration. When all indicators are assessed for the course, students interpret these summary statistics in an assignment called SPI (Sustainability Performance Interpretation); SPI is described below in the Syllabus section.
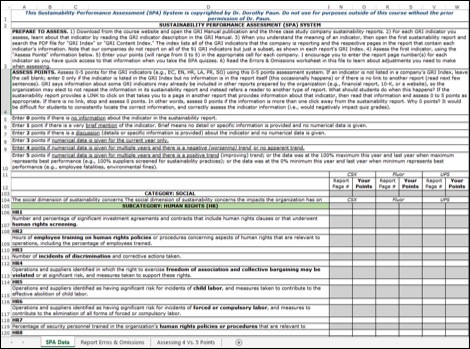
Figure 1a: The SPA Data Worksheet (Top Rows)
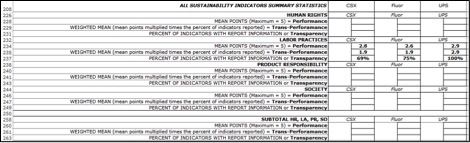
Figure 1b: The SPA Data Worksheet (Bottom Rows Summary Statistics)
2) Report Errors and Omissions Worksheet
Before a course begins, the professor assesses sustainability performance for all indicators and reconciles assessed points with two others (e.g., TA, reader-grader). During this assessment, errors or omissions are discovered in the case study company’s sustainability report, and that information is given to students via the Report Errors & Omissions worksheet (Figure 2). In this worksheet, the columns from left to right read: GRI Indicator(s) (Column A), Firm (Column B), Clarification about the Sustainability Report (Column C), Error in the Sustainability Report (Column D), Omission in the Sustainability Report (Column E), and How to Correct or Compensate the Clarification, Error or Omission (Column F).
First, a word about GRI Index. Almost all reports have a GRI Index, located near the end of each report. The Index conveniently lists the page number(s) where each indicator is presented in the report. As discussed earlier, students paste indicator page numbers, which they retrieve from each sustainability report, in to the appropriate cell in the SPA Data file. Now, here is an example or a report omission.
Looking at Row 4 in Figure 2, the indicator in question is LA9 (Labor Practices) for the firm CSX. Column E reads, “LA9 is not listed in the GRI Index.” Column F provides guidance on how to correct this omission, “LA9 is reported on page 69. Add LA9 and page 69 to the CSX GRI Index on page 63, just before LA10.”
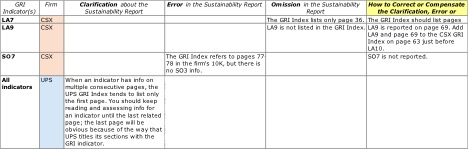
Figure 2: Report Errors and Omissions Worksheet (note that column letters are not shown on in the screen shot even though they are referred to in the texts)
3) Assessing 4 Vs. 5 Points Worksheet
The SPA Data worksheet provides a key for assessing 0-5 points. When Dr. Paun taught a course using SPA for the first time, it became apparent that there was one issue that confused students and eroded this confidence in using sustainability reports, and that was assessing 4 versus 5 points. To minimize confusion, Dr. Paun created an additional worksheet that drills down and describes how to best discern between assessing four points for a negative trend or no apparent trend and 5 points for a positive trend, under different indicator scenarios. The columns, from left to right read: Situation, Indicator Example, Years of Data, Negative Trend Example, No Trend Example, and Positive Trend Example. Here is an example of how the worksheet informs. In Figure 3, the second to the last row’s left column reads, “Indicator has 2 components and data for 2 years.” The second column in this row, we are told that the Labor Practices indicator LA12 is the context for this example and that LA12 refers to reporting performance by the breakdown of employees according to gender, age group, minority groups, and other indicators of diversity. The third column to the right shows that the company reported data for two years. The fourth column shows an example of a negative trend (4 points): if the company reported a decrease in all of the LA12 components over the past two years (e.g., decreasing minorities, decreasing women in management, etc.), give 4 points. The fifth column gives an example of no apparent trend (i.e., the company reported a decrease in some of the LA12 components and an increase in other LA12 components), which would also receive 4 points, if the company reported a decrease in some of the LA12 components and an increase in other LA12 components. The last column says a positive trend (5 points) would exist for LA12 if the company reported an increase in all of the LA12 components over the past two years.
Some readers may wonder why there is no distinction: students assess 4 points for both a negative trend and no apparent trend. This distinction is the one instance where simplicity was emphasized over complexity, because it would not have a material impact on the summary statistics. It is not uncommon for Dr. Paun’s courses to have undergraduate students ranging from freshman to seniors and a dozen different majors (e.g., environmental science, business, engineering, communication, psychology, law, pre-majors, architecture). Most students come into the course with little or no sustainability and/or business and/or research knowledge. By the end of the course, students report having a solid understanding, and experience with, all three disciplines (see the Outcomes section in this article) and are confident in their ability to accurately assess sustainability performance. Other readers may wonder why students are not asked to input raw sustainability performance data, and the answer is it is too complex and would generate data discrepancies due to different units of measure to report certain indicators. Inputting raw data is reserved for Dr. Paun’s graduate student research seminars.

Figure 3: Assessing 4 Vs. 5 Points Worksheet
Now that the SPA Data file has been described, let’s look at how SPA is communicated to students. The most effective way to do that is by sharing SPA information from the course syllabus. Syllabus information repeatedly refers to the SPA Data file, so consult Figures 1-3 as needed. Note that this article describes using SPA for the GRI social sustainability indicators; environment and economic indicators are the focus of another course taught by Paun.
Course Syllabus SPA and SPI Information
Overview of SPA and SPI
There are two separate but related sustainability performance assignments: SPA and SPI. Students complete the SPA assignment which forms the basis for the SPI paper. These two sustainability assignments are briefly described next. Then this section of the syllabus provides detailed information about the how to do the SPA assignment. The section that follows provides information about the SPI assignment. The modules guide you through the assignments.
- Sustainability Performance Assessment (SPA) assignment. Students conduct a sustainability performance assessment for three case study companies. “Assessment” means to review sustainability report information and then assess 0-5 points using the SPA System described in the SPA Data file’s SPA Data worksheet. Students’ deliverables are SPA file uploads (complete/incomplete grade) and completed SPA quizzes.
- Sustainability Performance Interpretation (SPI) assignment. After students complete the SPA quizzes, they write a paper that interprets SPA summary statistics (in the bottom rows in the SPA Data worksheet). The basis for the SPI paper is the completed SPA Data file. Students’ deliverable is the SPI paper.
SPA Learning Objectives
At the end of this assignment students should be able to:
- Describe sustainability reporting and the GRI indicators for measuring sustainability performance.
- Assess real world sustainability performance using corporate sustainability reports and GRI indicators.
- Analyze and interpret sustainability performance data.
Sustainability Reporting and GRI (Global Reporting Initiative). Sustainability reports (also called environmental, citizenship, corporate social responsibility, or CSR reports) are voluntary. A sustainability report discloses a company’s impacts on the environment and society. Sustainability reporting has many potential benefits. It helps companies set goals, measure performance, understand their sustainability impacts, manage change to make operations more sustainable, and reduces legal risks, forecast inaccuracies, insurance rates, and waste. Additionally, sustainability reports enhance accountability, credibility, and stakeholder transparency (all those who are affected by and can affect an organization, Freeman 1984). Sustainability reports may improve the company’s reputation and relations with the public and regulatory bodies, attract socially responsible investors, and produces more loyal customers. The Global Reporting Initiative (GRI) provides principles, widely accepted rules and procedures for reporting environmental and social performance are the equivalent of GAAP for financial reporting.
GRI Sustainability Reporting Framework. The GRI sustainability reporting framework provides methods and metrics (called indicators) for measuring and reporting sustainability impacts and performance in three areas: 1) Economic, 2) Environmental, and 3) Social (consists of four sub-categories: Human Rights, Labor Practices, Product Responsibility, and Society). These three GRI categories are briefly described below. In this course (Marketing and Management From a Sustainability Perspective) students learn to assess sustainability performance relating to the GRI Social indicators. In a companion course called Finance and Accounting From a Sustainability Perspective, students learn to assess sustainability performance relating to the GRI Economic and Environment categories as well as traditional corporate financial performance.
- Economic (EC) Category: The economic dimension concerns the organization’s impacts on the economic conditions of stakeholders and throughout society (local, regional, national, global). It does not focus on the financial condition of the organization.
- Environment (EN) Category: The environmental dimension concerns the organization’s impact on living and non-living natural systems, including land, air, water, biodiversity, and ecosystems.
- Social Category: The social dimension concerns the organization’s impact on the social systems within which it operates. There are four sub-categories: Human Rights (HR), Labor Practices (LA), Product Responsibility (PR), and Society (S).
How to Do the SPA Assignment
Students conduct a sustainability performance assessment for three case study companies. “Assessment” means to review sustainability report information and then assess 0-5 points using the SPA System described in the SPA Data file’s SPA Data worksheet.
- Before beginning the assessing process, it is important that all three sustainability reports are easily accessible. Some assessors may find it effective to print out each of the sustainability reports. Printing makes it simpler to mark up the document as is necessary. Others may prefer to use the digital form of the sustainability reports. In either case, a PDF reader software should be downloaded and installed for viewing and note taking purposes. A PDF reader enables students to easily read, highlight, and take notes on the reports they are assessing. The PDF search tool also allows readers to search for key words or phrases within the document. Students consider personal learning styles before deciding upon a method. Students skim the reports to gain familiarity and then go to each company’s website to read the About This is a great way to become familiar with the case study companies by briefly learning some facts about the company, like its size and locations of operation, industry position, financial health, and mission and vision statements. After establishing an general understanding of each case study company, then open the sustainability reports and start reading the introductory pages: Chairman’s Message for CSX, Chairman & CEO Letter for Fluor, and CEO Statement for UPS. These sections of the reports provide insight into what the companies are trying to emphasize and communicate in their sustainability reports.
- The GRI Manual is a first-line resource to those working through the SPA process. There are three sections for each indicator in the GRI Manual: Description, Relevance, and Compilation. The Description section consists of brief definitions of what the indicator is measuring. The Relevance section explains how that particular indicator is related to sustainability performances and discusses the importance of the indicator to the overall report. The Compliance section details out what exactly companies should be reporting and how (in what manner) that information should be disclosed. The Compliance section is the most helpful tool in SPA because it discusses in detail exactly what companies are expected to report. This section can be compared with the information disclosed in the reports to figure out how thoroughly the company is reporting. For each module, read the pages from the GRI Manual publication assigned to that module, so students fully understand the meaning of each indicator before assessing performance.
- Students also need to have the SPA Data file on hand. The SPA System is completely captured in the SPA Data file. The SPA Data file’s framework and computing formulas have been prepared by Dr. Paun, and students use this file to input their assessed points for the sustainability indicators and the associated report page numbers. Note that the file has three worksheets, which will be explained in the next section, called SPA Data, Assessing 4 Versus 5 Points, and Report Errors and Omissions.
- Next, students open a sustainability report and locate the GRI Index (sometimes it is called the GRI Content Index) which is near the end of each report. Students find the first GRI indicator that they are assessing to locate the relevant page numbers in the sustainability report. They paste those page numbers in to the appropriate cell in the SPA Data worksheet, so they have them in a convenient location for future reference. Sometimes the GRI Index has a page number error or other type of error or omission. These are described in the SPA Data worksheet’s Report Errors and Omissions worksheet. Students consult that worksheet before assessing each indicator.
- Students decide how many points to assess for each indicator (How to Assess Points info is in the top rows of the SPA Data worksheet) for each company. Enter 0-5 points in the SPA Data worksheet for each indicator. We suggest assessing each GRI indicator for all three companies at the same time before moving on to the next GRI indicator, for better interfirm consistency. If students are unclear about the difference between assessing four and five points, they can consult the Assessing 4 Versus 5 Points worksheet in the SPA Data worksheet.
There are four activities associated with each SPA module: READ, ASSESS, UPLOAD, and take the QUIZ, as described in Table 3 below.
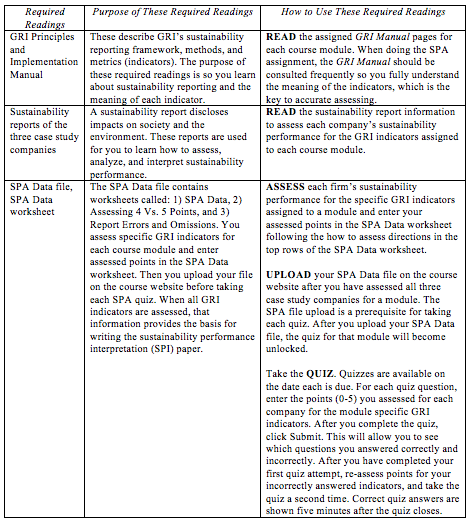
Table 3: Activities Associated with Each SPA Module
How to Do the SPI Assignment
After students complete the SPA quizzes, they write a paper that interprets the SPA summary statistics. The basis for the SPI paper is the completed SPA Data file’s SPA Data worksheet. Their directions are to:
- Read again each company’s sustainability report to deepen the students’ understanding of the companies’ sustainability performance.
- Review the SPA Data worksheet summary statistics.
- Do an intra-firm (within) comparative sustainability performance analysis. How did each company perform in terms of the four sub-categories: Human Rights (HR), Labor Practices and Decent Work (LA), Product Responsibility (PR), and Society (SO). For example, did CSX have higher (or lower) Human Rights (HR) performance compared to Labor Practices and Decent Work (LA), Product Responsibility (PR), Society (SO) performances? Labor Practices and Decent Work (LA) performance compared to Human Rights (HR), Product Responsibility (PR), Society (SO) performances? Product Responsibility (PR) performance compared to Human Rights (HR), Labor Practices and Decent Work (LA), Society (SO) performances? Society (SO) performance compared to Human Rights (HR), Labor Practices and Decent Work (LA), Product Responsibility (PR) performances?
- Do an inter-firm (among) comparative sustainability performance analysis. For example, did CSX have higher (or lower) Human Rights (HR) performance compared Fluor and UPS? Higher (or lower) Labor Practices and Decent Work (LA) performance? Higher (or lower) Product Responsibility (PR) performance? Higher (or lower) Society (SO) performance?
- Then, rank the case study companies from highest to lowest, in terms of their overall sustainability performance (last item in the grading rubric).
- Write a paper describing the students’ interpretation of findings. A) Organize the paper according to the grading rubric using the organizing template (next page). B) Write a comprehensive and thorough interpretative paper. Provide examples from the sustainability reports, and compare the companies in terms of their summary descriptive statistics in the SPA Data Answer file provided by Dr. Paun after the last SPA quiz. C) Proofread to check spelling, grammar, clarity, and check to make sure that the paper answers all of the grading rubric questions, is not above or too far below the page limitation (see below), and that students have not pasted text from online documents or those written by others.
- Maximum paper length is 8 pages and should be single spaced.
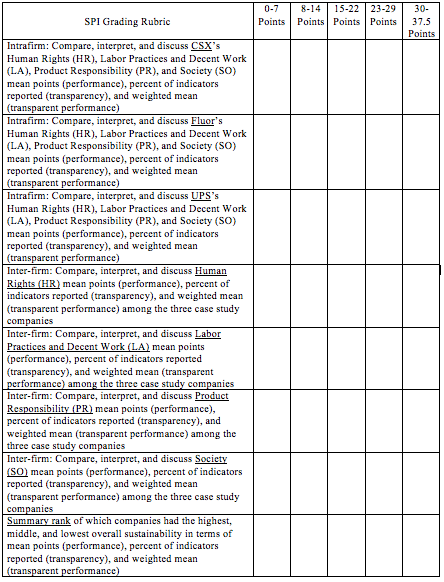
Table 4: Grading Rubric
STUDENT LEARNING OUTCOMES
To receive feedback about the degree to which SPA and SPI resulted in increased sustainability knowledge and skills for analyzing information and data in sustainability reports, at the end of the course students were asked about their SPA and SPI experiences. Of the 81 students registered in the course, 90.1% (n=73) responded. Students were asked, “Describe your best takeaway (i.e., gain) from the SPA and SPI experiences.” This open ended question did not prompt students to comment on their sustainability knowledge or analytical skills, the intention was to observe the saliency of any increases in sustainability knowledge and skills.
As Table 5 shows, 96.0% (70/73) of the respondents commented on their increased sustainability knowledge and/or skills for assessing sustainability report information. More specifically, 72.6% commented on both their increased sustainability knowledge and skills for assessing sustainability report information; 12.3% wrote only about their increased sustainability knowledge; 11.0% wrote only about their increased skills for assessing sustainability report information; and the remaining 4.1% wrote generic comments such as they liked the course/it was a good experience.

Table 5: Number and Percent of Survey Respondents Reporting Increased Sustainability Knowledge and Skills for assessing sustainability report information.
Increased Sustainability Knowledge
Examples of thematically arranged sustainability knowledge comments follow.
Increased Knowledge About Sustainability in General
- Before this class, I only considered “green” or “eco-friendly” labels on the packages. Now I know that sustainability extends to not only the physical environment, but also human rights and society at large.
- Sustainability became a meaningful, defined concept and practice that I use to evaluate all number of things now that I am armed with considerable knowledge about it. The SPA and SPI experiences best facilitated this transformation through meaningful analysis of real world data.
- My greatest gain from the SPA and SPI experiences is that sustainability as a general concept, as well as sustainability practices, are now a far more “real” idea and reality than before. Previously, sustainability was a term that I heard used to refer green marketing that was confusing because the definition about what sustainability is actually changed with the product. My experiences with SPA and SPI gave much needed depth and understanding to not only what sustainability is by definition, but also how each facet (that we covered) works on its own and with other sustainability practices.
Increased Knowledge About How Sustainability Relates to Business
- I learned a lot about what sustainability actually implies for companies and stakeholders. For example, I was surprised to learn that product labeling was considered part of sustainability. It makes sense now considering that sustainability includes demonstrating responsibility towards all stakeholders. Other aspects like fair labor practices, community involvement, and transparency will come to mind much more quickly when I hear the word “sustainability.” Equally valuable was learning that stakeholders includes everyone and everything impacted by a company, and not just its shareholders. I have already applied this concept to other classes. I think keeping all stakeholders in mind is valuable because it can be easy to overlook the impact of a business decision (especially for a large business) on a certain group. Simply being aware of this makes me consider more carefully how my decisions impact others.
- Doing the SPA and SPI allowed me to go through and be a critic of sustainability performance. This allowed me to learn about everything that companies should consider when talking about sustainability. The work done here will allow me to more consciously try to improve how the business I am involved with approaches sustainability. This is huge for me since the major I am in is based around creating a more sustainable future.
- This class mostly helped me learn about the evolving role of businesses in society. I liked learning about the different eras of business, how businesses used to be about profit at the top but now it’s evolving to encompass more social responsibility aspects. I think this is important because the globalization of businesses. I believe that business are going to continue to grow, but this doesn’t necessarily have to be a bad thing if these businesses are giving back to the societies that they live in.
- I would say the greatest takeaway may be the importance of placing emphasis on transparency and thoroughness within the context of developing a sustainable business practice. Whether it’s a smaller, private business, or a very large public company, business operators should always take into consideration the sustainability of how they conduct business, as well as why it’s important to do so.
Increased Knowledge About Sustainability Reports
- I’d never read a sustainability report before this class and frankly I did not care about a company’s sustainability as much as I should have. However, after having the SPA and SPI experiences, I have much more appreciation for companies that do report on their sustainability.
- I learned how to read sustainability reports, information that I had never utilized before and compare different sustainability reports.
- SPA and SPI helped me understand the business perspective of sustainability, particularly social sustainability. Reading through sustainability reports and the GRI manual was, first, a whole new avenue of sustainability I wasn’t even aware of, and second, provided detailed insight in how to incorporate sustainability into business practices and management.
- I learned allot about sustainability reports and now understand what a good sustainability report looks like.
- The sustainability reports at first seemed intimidating because they were so long in length, but after Dr. Paun’s SPA mentoring conferences it seemed fairly straightforward how to assess each indicator of sustainability.
Increased Skills for Assessing Sustainability Report Information
- SPA helped me gain a clear and comprehensive understanding of and skills for assessing and critically analyzing performances from reading the sustainability reports.
- My biggest takeaway was the ability to succinctly interpret sustainability data. The SPA system made it easy to understand company performance and to make comparisons more definitive versus speculative.
- Learning how to assess and interpret the sustainability performance of three case-studies allowed me an insight into the real-life and working practices of sustainability. I now have skills for evaluating a company’s sustainability performance and understand what it looks like to be, or not to be, a sustainable company.
- I have a deeper understanding of sustainability through hands on experience evaluating the companies. Having a deep focus on a selected area of sustainability each week, where I was able to get a well-rounded understanding of the area, helped me to see how companies affect different aspects of sustainability. The SPI paper allowed me to connect all that I had assessed in a clear manner to compare the different companies. This paper was very useful as it allowed me to compare all the numbers I had assessed, and understand the importance of transparency for a company.
- I gained experience analyzing company reports. I familiarized myself with reading reports and deciphering business language, something I will be doing a lot in my career.
- The SPA and SPI experiences have made me gain a better understanding of the technical aspect of interpreting sustainability reports, which was a nice change from the more philosophical and abstract concepts covered in classes.
- The best takeaway from SPA was is it provided a standard, or specific steps of reading and understanding the GRI manual and company sustainability reports.
CLOSING REMARKS
Sustainability reports are issued by the majority of companies and provide vast amounts of longitudinal data that are available to the public, yet these reports are vastly underutilized due to perceived complexity. This article explained the SPA System, a tool for assessing sustainability report information intrafirm (over time) and interfirm (comparing sustainability performance among firms). Ninety-six percent of students indicated that SPA reduced report complexity through enhancing their sustainability knowledge and analytical skills. Students reported a deeper understanding of sustainability as a concept, sustainability from a business perspective, and enhanced comprehension of multi-faceted sustainability performance information presented in sustainability reports. Further, students communicated their ability to confidently utilize sustainability report information to assess and compare corporate sustainability performance. The real world research-focused SPA tool appears to transform sustainability from a “philosophical and abstract concept” to something of tangible value in everyday life – as consumers, employees, and stakeholders.
REFERENCES
Bartel, Wim, Jennifer Iansen-Rogers, and Judy Kuszewski (2008), Count Me In: The Readers’ Take on Sustainability Reporting. Amsterdam: KPMG Sustainability B.V. and SustainAbility Ltd.
Dyllick, Thomas and Kai Hockerts (2002). “Beyond the Business Case For Corporate Sustainability, Business Strategy and the Environment, Volume 11 (2), 130–141.
Global Reporting Initiative (2014), GRI Implementation Manual. Amsterdam: Global Reporting Initiative. . (accessed December 1, 2015), [available at https://www.globalreporting.org/resourcelibrary/GRIG4-Part2-Implementation-Manual.pdf]
Global Reporting Initiative (2014), GRI Reporting Principles and Standard Disclosures. Amsterdam: Global Reporting Initiative. (accessed December 1, 2015), [available at https://www.globalreporting.org/resourcelibrary/GRIG4-Part1-Reporting-Principles-and-Standard-Disclosures.pdf]
Governance & Accountability Institute (2014), [“Primary Authors” Lindsey Clark and David Master] 2012 Corporate ESG / Sustainability / Responsibility Reporting – Does It Matter? An Analysis of S&P 500 Companies. New York: Governance & Accountability Institute, Inc.
Herremans, Irene, Jamal Nazari, and Feresheh Mahmoudian (2015), “Stakeholder Relationships, Engagement, and Sustainability Reporting,” Journal of Business Ethics, Volume 138 (3), 417-435.
KPMG (2013), The KPMG Survey of Corporate Responsibility Reporting 2013. Zug, Switzerland: KPMG International.
Obermiller, Carl and April Atwood (2014), “Comparing Faculty and Student Sustainability Literacy: Are We Fit to Lead?,” Journal of Sustainability Education, December (7), (accessed November 30, 2015), [available a http://www.jsedimensions.org/wordpress/wp-content/uploads/2014/12/Overmille-Atwood-JSE-Vol-7-Dec-2014.pdf].
Paun, Dorothy (2015), Marketing and Management From a Sustainability Perspective Course Syllabus. Seattle, Washington: University of Washington.
Watts, Stephanie (2015a), Corporate Social Responsibility Reporting Platforms: Enabling Transparency for Accountability, Information Technology Management, Volume 16 (1): 19–35.
Watts, Stephanie (2015b), Erratum to: Corporate Social Responsibility Reporting Platforms: Enabling Transparency for Accountability, Information Technology Management, Volume 16 (2): 37.


 Dorothy Paun (dap@uw.edu) is an associate professor at the University of Washington and teaches and conducts research on corporate sustainability performance. She has a marketing Ph.D. from the University of Oregon, finance M.B.A. from the Universiteit of Leuven (Belgium), and natural resources B.S. from the University of Wisconsin-Madison. Dr. Paun has received the prestigious Fulbright Distinguished Chair Research Award and has over 150 publications, research posters, and presentations. She has been a visiting professor in Canada, Finland, Germany, and Italy. Dorothy teaches sustainability courses that integrate conceptual learning with conducting real world sustainability performance assessment research, and she has been nominated for a teaching award on several occasions. Prior to her academic career, she was a stockbroker and an Alaska park ranger.