
Villavicencio JSE General Issue Dec 2018 – Feb 2019 PDF [2]
Abstract: The purpose of this paper is to describe the application of a sustainable learning framework through a community-based project in the Southern California region. The Sage Project is a partnership between San Diego State University (SDSU) and a local government in San Diego, California. The framework promoted educational innovation by allowing students to utilize existing courses and focus on partner-identified real-world projects to help advance the needs of partnering cities. Recognizing the need for air quality research in the partner cities and after consulting with both local governments regarding their environmental needs, SDSU graduate students were able to conduct research and communicate their results concerning air quality in a manner that benefits local community stakeholders, as well as, the university and students involved. Through the assembly and quantification of air pollution data, graduate students provided a brief snapshot of air quality trends in partnering cities to establish a foundation of air quality results to be used toward generating mitigation strategies to reduce particulate matter air pollution. By providing never before conducted air quality research in both communities through a sustainable educational model, both community partners and students benefited through enhanced research and community engagement opportunities while community partners obtained valuable and informative research, ideas, and solutions concerning their community needs. This paper provides a demonstration of the ability for project-based curricula facilitated through a community and university partnership to be replicable in higher education coursework.
Keywords: Sustainable Cities, Air Quality Assessment, Community-Based Projects, Higher Education, Project-Based Learning, City Partnership
Introduction
This paper explores an air quality research project that was conducted as part of a sustainable campus-community partnership framework known as the Sage Project. The Sage Project involves a partnership between San Diego State University (SDSU) and a local government in the San Diego region. The partnership described in this paper consisted of a multi-year faculty-directed graduate student research project in collaboration with the partner cities of National City and Lemon Grove, California, and SDSU. Through this sustainable education framework, students and faculty engage in partner-directed projects and contribute to raising awareness of social needs in a community in SDSU’s service area. Each year, the Sage Project engages hundreds of SDSU students from diverse disciplines to address livability and sustainability goals through community-based projects, thereby generating innovative ideas directed at building a more equitable and sustainable future for communities in the region. The model promotes educational innovation by allowing students to utilize existing courses and focus on partner-identified real-world projects to help advance the needs of communities (Schlossberg, 2018; Alexander and Pushnik, 2017). The framework provides a foundation for universities to develop innovative institutional approaches and organizational models to support interdisciplinary and transdisciplinary scholarship (Allen, Ervin, Wortham-Galvin, & Sherman, 2017). Universities have the capacity to contribute extensive resources such as technical and interdisciplinary research that is significant and impactful. In addition, students benefit by engaging in meaningful projects within their region that promote community resilience and sustainability while taking an active role in their learning (Barlow, 2018).
The air quality research project conducted by SDSU graduate students incorporated analysis of particulate matter (PM) pollution in outdoor air throughout their partnering cities. PM is composed of very small pieces of liquid or solid matter that may be suspended in the air and vary in size and chemical composition. Fine particles, which are also referred as PM2.5, are particles that have an aerodynamic diameter of 2.5 micrometers or less (US EPA, 2016). Due to its ability to persist in the environment and enter the lungs, PM air pollution is a major public health problem in urban areas, representing significant health risks to exposed populations and its presence in the environment is heavily regulated by the United States Environmental Protection Agency (APHA,2017; US EPA, 2016). As a result, the public faces serious health risks from exposure to elevated levels of ambient air pollution, particularly sensitive populations (i.e. children, the elderly, and those with compromised immune systems), who face an increased risk to adverse health conditions (Carlsten, 2015; CDC, 2018; Cromar, 2016; US EPA, 2018; Mannucci, 2015; Nadadur, 2015). In turn, this raises a significant challenge for local governments, such as the cities of National City and Lemon Grove, due to the lack of access to real-time air quality reporting data. Thus, there is a growing need for air quality research in municipalities to provide local governments the ability to make quantitative decisions to mitigate rising air pollution concerns and take appropriate actions to meet their cities’ sustainability demands.
Through participation in Sage Project partnerships with these cities, SDSU graduate students conducted an air quality investigation of outdoor air pollution through several air monitoring methods examining PM2.5in each city. This paper will discuss the findings of this investigation through an analysis of real-time particulate matter data and multi-year temporal and diurnal patterns of PM2.5 outdoor air samples that were collected by the students. Finally, this paper will discuss the application of sustainable learning in higher education by giving students the opportunity to develop a variety of real-world experiences and enhance skills that go beyond typical lecture-based classroom forums, while synergistically providing their service region with innovative solutions to the community’s pressing problems.
The Sage Project at SDSU: An Adaptation of the EPIC Model
The Sage Project at SDSU follows the partnership model referred to as the Educational Partnerships for Innovation in Communities Network (EPIC-N) Model that originated with the University of Oregon’s Sustainable City Year Program (SCYP) in 2009 (Schlossberg & Larco, 2013). The EPIC Model provides a foundation for universities to develop innovative institutional approaches and organizational models to support interdisciplinary and transdisciplinary scholarship (Allen et al., 2017). The model works to create learning experiences for students to bridge the knowledge gap of applying theory to practice through a project-based curriculum (Alexander, 2017; Schlossberg, 2013).
Each year, the model effectively engages hundreds of SDSU students from diverse disciplines to address livability and sustainability goals through these community-based projects, thereby generating innovative ideas directed at building a more equitable and sustainable future for communities in the region. Such project-based curricula at institutions include the University of Oregon’s SCYP, the University of Minnesota Resilient Communities Project, and the Iowa Initiative for Sustainable Communities at the University of Iowa (University of Oregon, 2016; Schlossberg, 2018). Project-based curricula also put students in situational conditions that allow them to gain a deeper understanding of material through actively creating working projects stemming from their own ideas. Students who participate in situated learning, such as project-based learning (PBL), achieve higher classroom scores versus students in the traditional classroom learning settings (Marx, et al., 2004; Rivet & Krajcik 2004; Williams & Linn, 2002). Building from the platform of the EPIC Model, the Sage Project at SDSU has provided the opportunity for students to engage in real-world projects that are relevant to municipalities and communities across the university’s service region by providing an experience that will make an impact in their lives.
Community Partnership with the Sage Project
The Sage Project implemented air quality projects through partnerships with two communities in the greater San Diego region: the City of National City (2014, 2015) and the City of Lemon Grove (2017). National City is located in the south-west area of San Diego. Its population averages about 61,000 residents, and it is located near industrial zones and busy freeways (U.S. Census Bureau, 2016). Lemon Grove is a community of approximately 27,000 people in eastern San Diego County (Data USA, 2016). Although it is a small city, it is similarly located in an urban area with close proximity to freeways and industrial parks. Both municipalities, like many others, are facing modern-day challenges to meet societal needs of the 21st century (Alexander and Pushnik, 2017).
In an effort to meet societal and sustainability demands, both cities entered into a partnership with the Sage Project by proposing high-priority public and environmental projects based on their community’s needs that were then matched with university faculty and their courses (Barlow, 2018). As a result, of their partnerships with the Sage Project and SDSU, the Cities of National City and Lemon Grove were able to obtain valuable and informative research, ideas, and solutions concerning their community needs. In turn, participating faculty and students benefited from enhanced research and community engagement opportunities.
San Diego State University
Course and Project Matching
Upon evaluation of the community partner proposals and areas of interest, the existing air quality investigation course, Public Health 632 (PH 632), was matched with each respective city to assess current conditions regarding local air quality and to contribute to regional efforts to promote community resilience. The PH 632 course participated in projects with National City in 2014 and 2015 (NC ‘14 and NC ‘15) and with Lemon Grove in 2017 (LG ‘17). A goal of the collaboration was to quantify concentrations of particulate matter air pollution in various industrial, residential, and other hotspots (McKinstry & Chowdhury, 2015). The curriculum for PH 632 incorporated the goals of the Sage Project partnership while also following the educational criteria from the Council on Education for Public Health (CEPH), which provides accreditation to public health programs and ensures that curricula cover skills that include exposure assessment, data analysis, and critical thinking, thereby providing students a multitude of strategies for success in the 21st century (CEPH, 2016). Each year, the students planned, designed and conducted air pollution sampling studies, which simultaneously met the requirements of the Sage Project partnership and CEPH. PH 632 students collaborated through student-driven research projects and gained viable technology skills, and advanced competencies in communication and problem solving through practical application of real-world projects facilitated through project-based learning (Bell, 2010). Furthermore, students had the opportunity to present the findings from their research projects at the annual Sage Project Symposium along with students from other Sage Project participating courses at SDSU. In addition, select students from each participating class were hired by the Sage Project to consolidate the work of each class into a final report that served as the official deliverable to the city partner (e.g., Barekat and Chowdhury, 2015; Benitez & Villavicencio, 2018; Brennan, 2016; Lawless & Yip, 2018a,b 2018; Monteverde & Novak, 2016).
PH 632 Methods
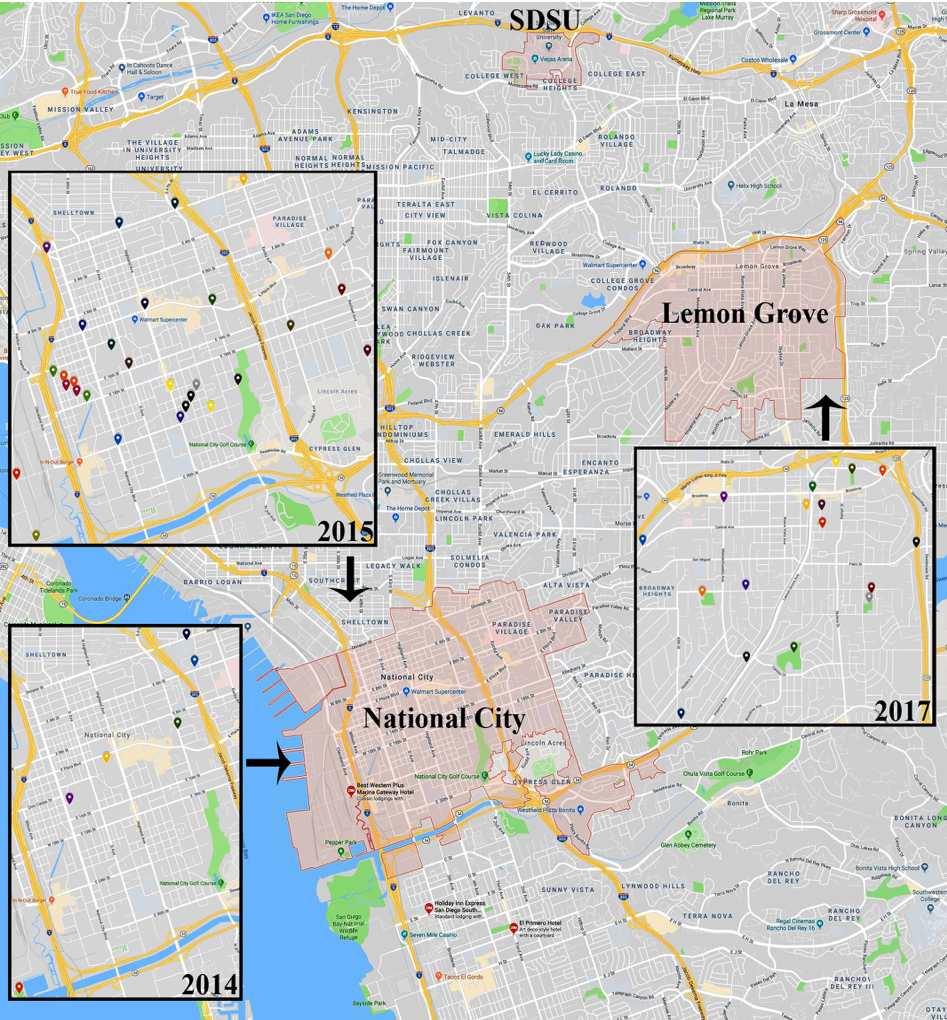
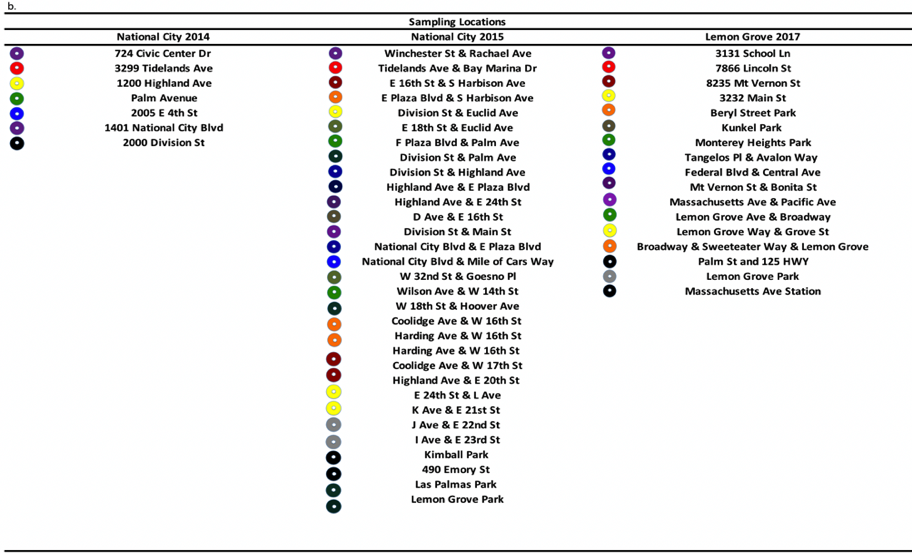
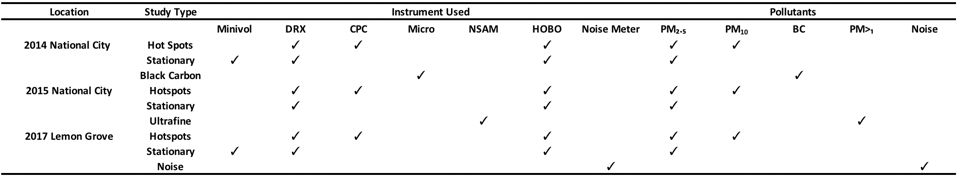
For each year of the Sage Project partnership, participating PH 632 students focused on smaller projects that addressed the overall project needs of the respective community partners and city officials. Overlapping areas of interest brought students to form student research groups to sample air quality through air pollution monitoring, which consisted of stationary, hotspot, and additional secondary sampling and monitoring methods. After learning the theory of various air quality instruments and techniques, the student research groups applied the sampling instruments needed for their projects based on their chosen pollutant of interest as shown in Table 1. Figure 1 displays the sampling locations for all participating years throughout the partner cities. The map provides a visual representation for local government and community residents to understand where air monitoring was conducted and to provide exact sampling locations. The figure demonstrates how students worked to gain a true representation of the partner cities’ air quality by sampling outdoor air pollution in varying locations. Findings from the investigation were analyzed and interpreted into meaningful results for non-technical audiences that will later be discussed in this paper.
 [3]
[3]
 [4]
[4]
Figure 1(a)(b).Google Maps view and sampling locations in National City 2014, 2015, and Lemon Grove 2017.
Villavicencio Figure 1b. PDF [5]
Stationary sampling consisted of measuring PM2.5concentrations at a fixed location providing multi-day 24-hr site monitoring to yield daily ambient concentrations. Hotspot sampling consisted of investigating concentrations of PM2.5at various locations throughout the city. Stationary and hotspot sampling methods were consistently used each participating year (2014, 2015, and 2017), while the locations differentiated based on the partnering city’s area of interest (Barekat and Chowdhury, 2015; Benitez & Villavicencio, 2018). An additional secondary sampling investigation was also added to each respective year and included black carbon (BC), ultrafine particle concentration and noise pollution based on students’ interest (See Table 1). Furthermore, during stationary, hotspot and additional secondary sampling studies, each instrument was calibrated appropriately as a means of quality assurance based on the manufacturer’s requirements, while all the data provided by the instruments were downloaded onto a laptop and stored after each sampling day to ensure quality control. For further details regarding respective sampling methods, refer to Barekat and Chowdhury (2015), and Benitez and Villavicencio (2018). As an outcome of faculty directed project-based learning, PH 632 students learned responsibility, accountability, and discipline by collaborating and setting expectations for themselves and peers (Bell, 2010).
 [6]
[6]
Table 1. Instruments used to measure pollutants of interest from student research groups in National City 2014, 2015 and Lemon Grove 2017
Laboratory Methods
Each participating year, the student research groups of PH 632 received instruction from the course instructor and a qualified graduate assistant on the proper care and handling of several air monitoring instruments for measuring different pollutant of interests (see Table 1), which will be described in detail later in this paper, as part of the laboratory portion of the course that took place in the SDSU’s School of Public Health laboratory. Under the supervision of the graduate assistant, they received training on proper analysis of the filters that were used by certain instruments (Minivol and MicroAeth) in order to ensure the correct particle concentrations were obtained and recorded. The course instructor also provided further training in the use of Microsoft Excel, which was utilized to analyze all collected data from the stationary, hotspot and additional secondary sampling groups. This allowed students to develop skills in generating tabular and visual models as part of the assessment portion of the course. Overall, as a student learning outcome of the PH632 course, the laboratory portion of the course allowed students to strengthen their skills of air monitoring instrumentation in a controlled setting through practical training in the lab, thereby building confidence in air monitoring before applying these skills in the field.
In-Field Sampling
After completing practical training in air quality monitoring, students conducted in-field sampling using various air monitoring equipment based on their pollutant of interest. Table 1 shows the instruments used per year to measure each pollutant of interest. Students involved in stationary sampling were required to sample at a fixed location chosen by the participating city daily for up to seven days to obtain continuous and gravimetric measurements of PM2.5. Three instruments were used in this study: TSI DustTrak DRX (MODEL 8533) (“DRX”) for continuous measurements; Onset HOBO U12 (Part #: U12-013) (“HOBO”); and Airmetrics MiniVol (“MiniVol”) for gravimetric measurements (TSI Incorporated, 2012; Onset Computer Corporation, 2016; DustTrak, 2017). Students arrived at the sampling site daily in order to ensure each instrument was operating appropriately and at the end of the day collected the Teflon filters from the Minivol. The MiniVol separates PM2.5and PM10particles on a teflon filter. Each filter was weighed before and after sampling, the difference in the filter indicates the PM2.5particle concentration. In-field stationary sampling allowed students to gain hands-on experience with instruments and techniques used by professionals in the field of air quality. They also strengthened skills in coordination, communication, and time management which are practical and applicable competencies to have as a working professional. For additional details regarding in-field sampling, refer to Barekat and Chowdhury (2015), Benitez and Villavicencio (2018), and McKinstry and Chowdhury (2015).
As shown in Table 1, hotspot sampling involved students sampling PM2.5(pollutant of interest) concentrations at various locations throughout the city that were of concern to city officials. Sampling varied by length of time, days and locations based on group project year. Hotspot sampling consistently involved coordination between research groups and transportation logistics of equipment and group members, recording observations, documenting activity logs, and troubleshooting. Instruments used throughout sampling included: DRX, HOBO, and TSI Condensation Particle Counter (Model 3007) (“CPC”) (TSI Incorporated, 2012). Students were able to build competencies in project management, quality assurance and control, by independently working as a team outside the classroom setting. Rather than a controlled, supervised environment, students had to account for confounders that could affect their project and potentially skew their results. Such experiences could be difficult to obtain in the classroom or laboratory setting; however, by putting theory into practice, the in-field portion of the course fostered growth in practical and real-world skills that are essential in professional development.
The additional secondary sampling studies for each year, as displayed in Table 1, were as follows: The study for NC ´14 consisted of measuring black carbon particle concentration. The samples were measured using a Model AE51 MicroAethalometer (“MicroAeth”). Data was gathered daily for seven days twice a day to determine if BC concentrations were different between weekdays and weekends. For NC ´15, students were interested in ultrafine particulate matter (PM<1) which is a nano-sized sub-fraction of PM and has an aerodynamic diameter of 0.1 micrometers or less (Li et al., 2003). The TSI Nanoparticle Surface Area Monitor (Model 3550) (“NSAM”) was used to measure the surface area concentration of the particles. Ultrafine particle levels were sampled at a fixed location for a seven day period. Lastly, for LG ´17, noise levels were measured at various parks to determine if levels in the area constituted noise pollution (Suter, 1991). The study involved noise monitoring for approximately four days at 40-minute sampling periods per location. The 3M noise meter was used to measure noise levels for the duration of the noise sampling project.
Data Analysis and Reporting
Upon completion of data collection by the student research groups, data was extracted and analyzed. The learning objective for this portion of the course was to teach students the components of data analysis which included defining their objectives of analysis, preparing data, providing descriptive statistics in summary tables and graphs, and interpreting and reporting results. Students applied concepts, theories, frameworks, and methods obtained from the course to help arrive at their conclusions and support or reject their hypotheses. The data analysis portion of the course allowed students to build skills in quantitative analysis by focusing on measurements of the data to reveal their final results and conclusion of the research projects.
Since research has shown that precipitation and humidity affect air quality data measurements (Liu et al., 2011), students were required to review literature discerning various air quality methods in order to incorporate correction factors within their own data analysis process to correct for confounding effects as a means to secure precision and accuracy of their final results. For example, if rain was present during sampling, the data was separated to account for rainy vs. non-rainy days due to the higher humidity experienced during rain. Studies have shown that higher humidity will cause the instruments to overestimate particle concentrations, giving an inaccurate result (Sioutas et al., 2000). To correct for these confounders, students used a two-step correction factor, which included correcting for relative humidity (RH) and aerosol effects (Chakrabarti et al., 2004). Students received training to conduct accurate data analysis using the two-step correction process while simultaneously gaining an understanding of how air monitoring instruments (see Table 1) had the potential to be affected by environmental factors. Through the application of the two-step correction factor, students learned how to apply specific analysis techniques related to the field of air quality investigation. Upon completion of the data analysis portion of the course, students learned to understand, communicate, and interpret quantitative information, which ultimately provided them with the skills to evaluate information,assess validity, and design studies to adequately address their desired question of interest.
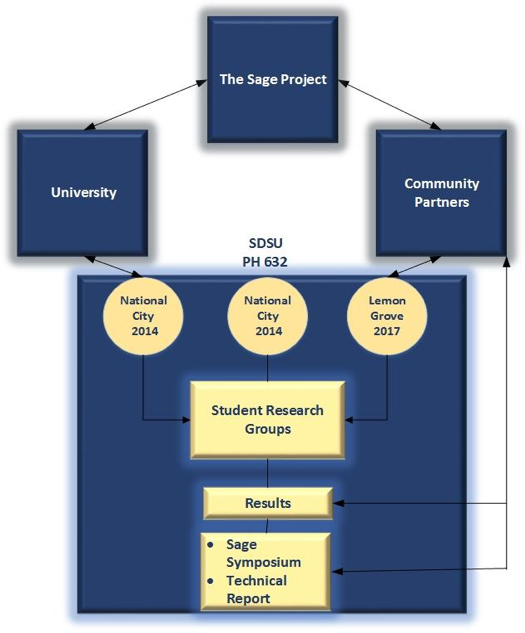
Near the end of the course, students had successfully developed skills in air quality investigation, laboratory application, in-field sampling, data analysis, project management and coordination. By the end of the course, student research groups presented and shared their research projects and reported their findings amongst classmates. Through this mode of classroom presentation, students engaged in a question and answer forum which allowed for meaningful discussion of topics they were passionate about. At the culmination of the project, each student research group collaboratively wrote an executive summary report summarizing their research to strengthen their skills in technical writing that could later be applied through individual graduate level coursework and professional employment. The report also provided supporting evidence of their final results by summarizing technical papers and published works that were used as references to build skills in research gathering and interpretation. In addition, the student research groups collectively presented and summarized their research objectives, methodology, and tabular and graphical results via a poster presentation at the Sage Project Symposium. This allowed students to collaborate to meet specific requirements for the poster and also present their shared findings and experience to other students, faculty, stakeholders, media and, most important, the city officials. Figure 2 illustrates the continuous relationship between the Sage Project, SDSU, and the community and how their interactions create a symbiotic relationship that every partner benefits from.
 [8]
[8]
Figure 2. A model of the continuous relationship between the Sage Project, University and Community Partners.
Results and Discussion
The multi-year collective air quality findings by the student research groups (NC ´14, NC ´15, LG ´17) were further reviewed and evaluated to interpret particulate matter temporal and diurnal distributions between each city. After ensuring that data collection, evaluation, and analysis were conducted accurately, air quality data findings were interpreted and reported to provide informative and valuable research to partnering communities that were derived from project-based curricula participating with the Sage Project. In addition, the work generated by students is documented and web-archived by the SDSU library, the Sage Project website, and partnering city, to allow the future generations of student, faculty and outside researchers to access this information online as a resource document. Lastly, public access to Sage Project reports (NC ´14, NC ´15, LG ´17) provides the opportunity for other institutions to reproduce and incorporate project-based curricula at other institutions as well as inspire other communities to engage with the Sage Project.
Results of Stationary Groups
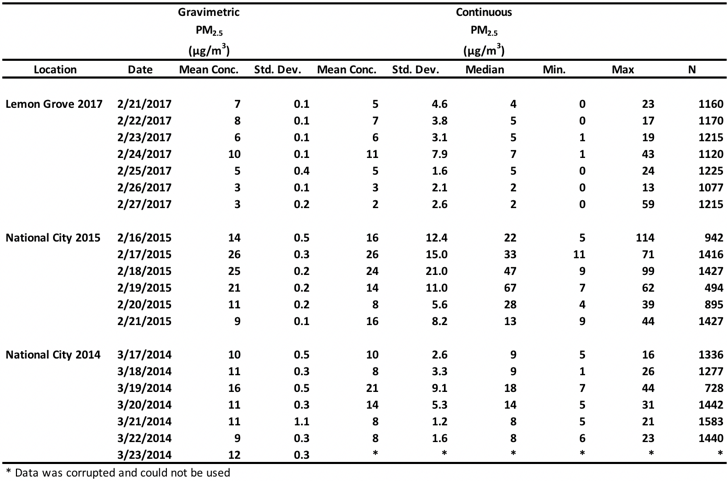
Results from the stationary sampling groups (NC ´14, NC ´15, LG ´17) were compiled and compared to regulatory agency standards. The National Ambient Air Quality Standards (NAAQS) set by the EPA, has based the limit for PM2.5levels for 24 hours of exposure and recommends that the public, including sensitive populations, not be exposed to more than 35 µg/m3of PM2.5in a 24-hour time period. In addition, the annual standards for exposure to PM2.5have been set to 12 µg/m3. Table 2 presents the final computed results from the stationary groups (NC ´14 and ´15, and LG ´17) comparing continuous and gravimetric daily mean concentrations of PM2.5for each participating year. Overall, based on the NAAQS, PM2.5levels remained below the recommended exposure level for a 24-hour period for all sampled years. However, PM2.5levels were determined to be the highest in National City 2015 (7.9-26.4 µg/m3) exceeding the 12µg/m3 annual standard, thereby raising concern for city officials and residents on the potential for PM2.5 levels to continue to elevate overtime if mitigation strategies are not implemented. Table 2 demonstrates how instruments have varying capabilities and illustrates that air pollution has the ability to fluctuate based on varying PM levels between sampling days. Through the analysis and generation of these results, students gained a greater understanding of the importance of proper quality control and assurance that must be taken by regulatory agencies to account for confounding effects, such as, meteorological effects that have the ability to skew and vary PM reporting data. By applying theory-based knowledge of air quality investigation, skills learned in the laboratory setting and in-field sampling, students were able to perform quality assessments and generate the data as seen in Table 2.
With the nearest air monitoring system to the community partners being in a different city, a true representation of the city partners’ air quality trends throughout the year are unavailable. Thus, the ability for student research groups to conduct air quality sampling in both cities (National City and Lemon Grove), provides a brief snapshot of air quality trends in both cities and helps establish a foundation of air quality results that can be used toward establishing mitigation strategies to reduce particulate matter air pollution.
 [9]
[9]
Table 2. Descriptive statistics comparing continuous and gravimetric daily mean concentrations of PM2.5 in µg/m3for all sampling days.
Villavicencio Table 2. PDF [10]
Results of Hotspots Groups
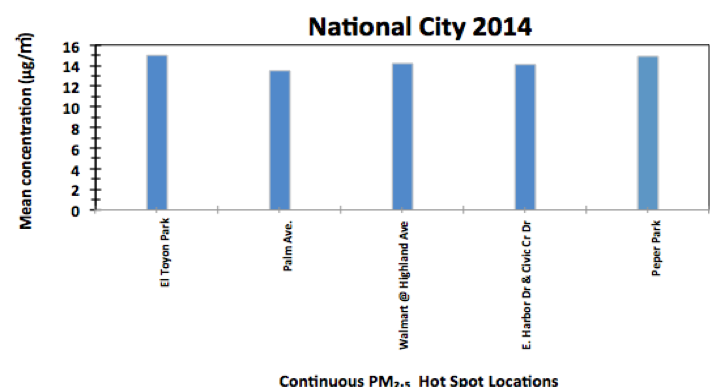
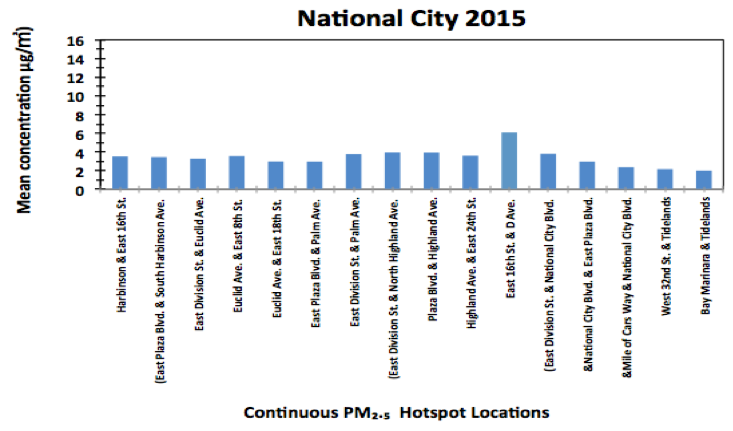
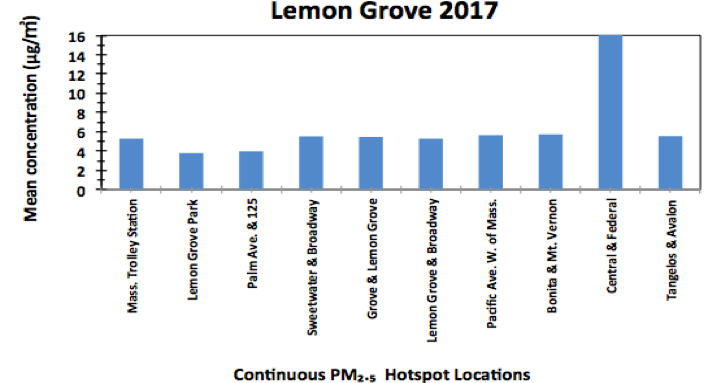
The final computed results from the Hotspot research groups (NC ´14, NC ´15, LG ´17) were compared year to year. PM2.5levels varied across groups and sampling intersections. Figure 3 (a)(b)(c) illustrates elevated levels of PM2.5at certain intersections. Overall, the study year in National City 2014 demonstrated the highest levels of PM2.5. The students noticed strong down wind currents from upwind locations that may have carried pollutants to descending areas during sampling that year, thus, could have played a role in the elevated PM levels. Research indicates that down-wind currents, proximity to industrial processes and vehicle emissions have the ability to increase concentrations of particulates in the atmosphere (Anderson, 2016; Huang et al., 2014). Through these observations, students referred to their data analysis training earlier in the course and evaluated the potential for outliers that may skew their results and corrected for these confounders through precision and correction factors. For further details about hotspot groups data analysis and interpretation of results, refer to Barekat and Chowdhury (2015), Benitez and Villavicencio (2018).
In addition, Figure 3 (a)(b)(c) demonstrates the fluctuation of PM levels throughout the city, identifying hotspot locations and illustrating the concern for the potential of increasing levels overtime, to attribute to exceeding the annual PM2.5standard of 12µg/m3 (US EPA, 2016). Thus, city officials can use this newly available data to determine locations of elevated levels of PM2.5throughout their city and can push for city initiatives to improve traffic flow during peak hours by incorporating methods of re-routing and promoting public and eco-friendly modes of transportation. In addition, detailing, tracking, and communicating areas of elevated PM to the public through a community website would be highly beneficial for sensitive populations (i.e., children, the elderly, immune-deficient populations, etc.) who may be more vulnerable to high levels of PM2.5thus, allowing them to plan their routes in avoidance of recognized elevated areas.
 [11]
[11]
 [12]
[12]
 [13]
[13]
Figure 3 (a)(b), and (c). Average daily PM2.5 concentrations at traffic intersections for all sampling days for each year
Villavicencio Figure 3a. PDF [14]
Villavicencio Figure 3b. PDF [15]
Villavicencio Figure 3c. PDF [16]
Results for the Additional Secondary Sampling
For the 2014 additional secondary sampling project, the MicroAeth was used to measure pollutant concentrations for a 24-hour period for seven days by measuring the accumulation of BC particulates (AethLabs, 2014). BC, or soot, is a pollutant of concern because it is a classified carcinogen and has been associated with deaths due to air pollution and also absorbs sunlight, warms the air, and contributes to global warming (Menon et al., 2002). The BC concentration was averaged and daily mean values were calculated for the entire week. As shown in Figure 4, the BC concentration results show that the lowest concentration was 0.24 µg/m3and the highest was 1.00 µg/m3. The lowest concentrations were observed during the weekend. Since the concentrations were higher during the weekdays, the City of National City can expand research to determine the likely sources that are affecting black carbon emissions during the week, such as higher traffic. If the sources of higher emissions are due to traffic, this can help the city to plan ways to reduce traffic on certain days or they could inform high risk groups to avoid walking or jogging around the areas of high exposure.
 [17]
[17]
Figure 4. Daily black carbon concentration averages in National City for seven days as sampled by MicroAeth.
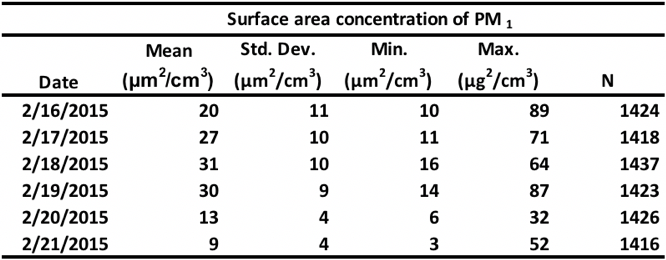
For 2015, the NSAM was used to measure the concentration of surface area deposition of PM1for a 24-hour period for seven days. Daily averages were calculated for the 7-day period with the low concentration of 9μm2/cm3and a high of 89μm2/cm3, and a weekly average of 22μm2/cm3(See Table 3). Studies indicate that ultrafine particles affect lung health and pose a serious public health risk (Nowack & Bucheli, 2007). Elderly populations, who are likely to experience reduced lung function due to their age, also experience an increase in respiratory problems due to exposure to air pollution. However, there are currently no standards regulating this pollutant and having this information brings awareness to their local government on the composition of the particles that residents are breathing in the air. Table 3 provides a snapshot of air quality data pertaining to ultrafine particles in the City of National City. Having such data can assist with determining quantitative solutions to rising air pollution concerns.
 [19]
[19]
Table 3. Statistical descriptions representing nanoparticle surface area measurements for six stationary sampling days as measured by the NSAM.
Villavicencio Table 3. PDF [20]
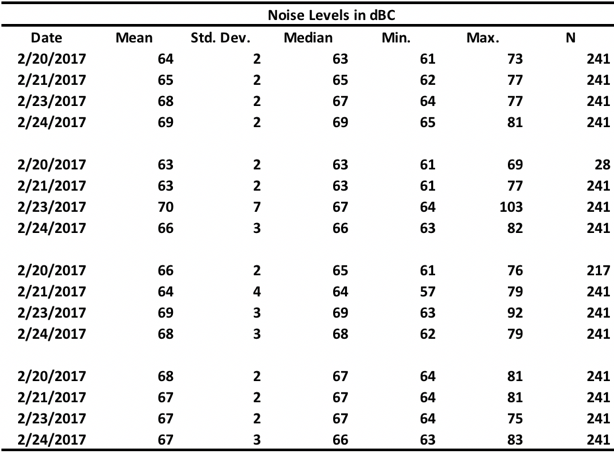
Lastly, for 2017, the 3M noise meter was used to measure decibels in dBC (d-weighted decibels) to quantify the loudness of sound relative to a 90 decibel sound pressure level, with a 1000-Hz reference tone. The mean collected data between all days determined that noise levels appeared normal for ambient noise (63-69 dBC) in the sampling areas and did not have the ability to cause significant hearing damage (>85 dBC as specified in occupational settings) (See Table 4). Additionally, the County of San Diego has established Noise Compatibility Guidelines for residential areas and has set acceptable limits for active parks at 70 dBC and at 65 dBC for residential areas (County of San Diego, 2011). According to the EPA, exposure to 55 decibels and above may lead to non-auditory health effects for exposure duration over 24 hours (U.S. EPA, 1974). Our findings suggest that community members may still be affected by noise pollution and further measurements are warranted into noise levels in community settings. These findings are significant for the City of Lemon Grove because of the lack of prior data quantifying noise in neighborhood parks. However, our findings provide a baseline for further investigation. These findings demonstrate how project-based curricula in higher education give students and faculty the opportunity to produce research that promotes social good and evaluates livability conditions of their local communities.
 [21]
[21]
Table 4. Noise levels for each park sampled by 3M noise meter for four days.
Villavicencio Table 4 PDF [22]
The collective findings by graduate students provide never-before-recorded particulate matter and additional secondary sampling data for the cities of Lemon Grove and National City that can provide a baseline and foundation to fill this knowledge gap. The quality of data and findings gathered by student research groups promote the importance and need for local air pollution monitoring. Local monitoring can significantly assist local government officials by providing real-time particulate matter assessments throughout the community to help identify stationary or hotspot sources that could be contributing to elevated PM levels and provide mitigating strategies to control for these sources. Moreover, through facilitated project-learning partnerships as seen through the Sage Project, SDSU and the Cities of Lemon Grove and National City, graduate students develop relevant experience in their field of interest, and gain technical, communication, and leadership skills that have the potential to assist them in attaining professional employment. In turn, the community partner benefits by gaining valuable real-time PM air quality assessments through student research projects that promote sustainability. While most city governments have strict budgets and limited manpower, engaging the help of university students allows them the opportunity to address areas of concern in the local community that are increasingly facing sustainability challenges of our modern era. The Sage Project and the EPIC Model have the ability to incorporate 10 to 15 projects per year, involve 20 to 30 courses, and engage with over 500 students (Barlow, 2018). Having the ability to tackle so many projects while involving so many students from varied disciplines is what makes this model so efficient and impactful. Moreover, the City of Lemon Grove has won two awards for their partnership with the Sage Project, and social and news media sources have also celebrated the accomplishments from the partnership, increasing community engagement. Together, the Sage Project and the EPIC Model maximize student benefits and demonstrate the feasibility of project-based learning in higher education coursework via a replicable university-community partnership (Barlow, 2018).
Conclusion
The Sage Project at SDSU creates an avenue for sustainable learning through community-based projects in higher education. Students seek opportunities to apply their skills, knowledge and creativity in real-world application settings while university faculty seek ways to engage with their students and community through impactful and meaningful projects. Through the partnerships established between SDSU and local communities, students across multiple disciplines are given the opportunity to develop a variety of real-world experiences and develop skills that go beyond typical lecture-based classroom forums. Rather than solely engaging in theory-based lectures and testing students on their ability to memorize information and understand conceptual ideas, project-based curricula, such as the present example, allow students to continuously build practical skills through hands-on learning and in-field application of theory-based techniques. Due to rising demands of the 21stcentury, local governments such as National City and Lemon Grove, are facing challenges mitigating solutions and adapting to environmental and sustainability demands due to the lack of quantitative real-time community-based research data. SDSU graduate students sought to fill this research gap by participating in the Sage Project (NC ´14, NC ´15, LG ´17). Through the assembly and quantification of air pollution data, students provided a brief snapshot of air quality trends in both cities to establish a foundation of air quality data that can help establish mitigation strategies to reduce particulate matter air pollution.
By providing never before conducted air quality research in both communities through a sustainable educational model, both community partners and students benefited through enhanced research and community engagement opportunities, while community partners obtained valuable and informative research, ideas, and solutions concerning their community needs. Additionally, the partnerships with the Cities of National City and Lemon Grove made it possible to engage community members and inform them of challenges and best practices in regard to air pollution and climate change. This was accomplished through community surveys, presentations to neighborhood and city council meetings, the Sage Project Symposium, as well as, through regular social and news media sources (e.g., Anderson, 2017) that celebrated the partnerships and highlighted accomplishments and findings from them.Moving forward, there is need to formally evaluate the EPIC Model as implemented by the Sage Project in order to assess the full impact on student learning outcomes.
References
AethLabs. (2014). microAeth tech specs. Retrieved from https://aethlabs.com/microaeth/tech- (accessed 24 November 2018)
Allen, J., Ervin, D., Wortham-Galvin, B.D., & Sherman, J. (2017). Introduction to the “Sustainable Solutions” series. In Wortham-Galvin, B. D. , Allen, J. H., & Sherman J.D.B. (eds.), Let knowledge serve the city(pp xi-xvi). New York: Routledge.
Alexander, F. K., & Pushnik, J. C. (2017). Public-public partnerships for a new paradigm in the civic role of the university. Sustainability: The Journal of Record, 10(5), 315-321. doi:10.1089/sus.2017.0007
American Public Health Association (APHA). (2017). Public Health Opportunities to Address the Health Effects of Air Pollution. Available at: http://www.apha.org/policies-and-advocacy/public-health-policy-statements/policy-database/2018/01/18/public-health-opportunities-to-address-the-health-effects-of-air-pollution [23](accessed 24 November 2018).
Anderson, E. (2017). SDSU Students Help Shape Climate Plan In Lemon Grove.KPBS Radio News,p. March 16. Retrieved from http://www.kpbs.org/news/2017/mar/16/students-shape-climate-plan-lemon-grove/ (accessed 24 November 2018).
Anderson, M. (2016). As the wind blows: the effect to long-term exposure to air pollution on mortality. University of California, Berkeley. Retrieved from: https://are.berkeley.edu/~mlanderson/pdf/air_pollution_highways.pdf (accessed 24 November 2018).
Barlow, J. A. (2018). The Sage Project: Community Engagement for Sustainable Cities. Experience Magazine: Practice and Theory, 2, 97-117.
Barekat, A., & Chowdhury Z. (2015). Air Quality in National City. The Sage Project. San Diego State University. Available at: https://digitallibrary.sdsu.edu/islandora/object/sdsu%3A4985 (accessed 24 November 2018).
Bell, S. (2010). Project-based learning for the 21st century: Skills for the future. Clearing House: A Journal of Educational Strategies, Issues and Ideas,83 (2), 39-43.
Benítez, A., & Villavicencio, J. (2018). Air Quality and noise pollution in Lemon Grove.The Sage Project at San Diego State University: San Diego, CA. Available at: https://digitallibrary.sdsu.edu/islandora/object/sdsu%3A19159 (accessed 24 November 2018).
Brennan, K. R. (2016). Noise level measurements and National City residents’ attitudes towards that noise. Unpublished doctoral project, San Diego State University – University of California, San Diego. Available at: https://digitallibrary.sdsu.edu/islandora/object/sdsu%3A4962 (accessed 24 November 2018).
Carlsten, C. (2017). Traffic-related air pollution and allergic disease: An update in the context of global urbanization. Current Opinion in Allergy and Clinical Immunology,17, 85-89.
Centers for Disease Control and Prevention (CDC) (2018). Air pollution and respiratory health. Available at: https://www.cdc.gov/nceh/airpollution (accessed 24 November 2018).
Chakrabarti B, Fine P. M., Delfino, R. and Sioutas, C. (2004) Performance evaluation of the active-flow personal dataram pm2.5 mass monitor (thermo anderson pdr-1200) designed for continuous personal exposure measurements. Atmospheric Environment,38, 3329-40
Council on Education for Public Health (2016). Accreditation Criteria. Schools of Public Health & Public Health Programs. Silver Springs, MD. Available at: https://ce [24]ph.org/assets/2016.Criteria.pdf (accessed 24 November 2018).
County of San Diego. (2011). Chapter 8: Noise Measurement. County of San Diego General Plan. Available at: https://www.sandiegocounty.gov/content/dam/sdc/pds/gpupdate/docs/GP/NoiseElement.pdf (accessed 24 November 2018).
Cromar, K. (2016). American Thoracic Society and Marron Institute report: Estimated excess morbidity and mortality caused by air pollution above American Thoracic Society-recommended standards, 2011–2013. Annals of the American Thoracic Society, 13,1195–1201.
Data USA (2016). Lemon Grove, CA. Available at: https://datausa.io/profile/geo/lemon-grove-ca/ (accessed 04 January 2018).
DustTrak DRX Aerosol Monitor 8533. (2017). TSI. Available at: http://www.tsi.com/dusttrak-drx-aerosol-monitor-8533/ (accessed 24 November 2018).
Huang, R.-J., Zhang, Y., Bozzetti, C., Ho, K.-F., Cao, J.-J., Han, Y., et al. (2014). High secondary aerosol contribution to particulate pollution during haze events in China. Nature, 514, 218.
Lawless, V., & Yip, C. (2018). Amendment and application of UN-Toolkit to San Diego State University’s Climate Action Plan: The world’s first. Presented at the Student Research Symposium, San Diego State University.
Li, N., Sioutas, C., Cho, A., Schmitz, D., Misra, C., Sempf, J., Wang, M., Oberley, T., Froines, J., Nel., A. (2003). Ultrafine particulate pollutants induce oxidative stress and mitochondrial damage. Environmental Health Perspectives, 111(4), 455-460.
Liu, P. F., Zhao, C. S., Göbel, T., Hallbauer, E., Nowak, A., Ran, L., Wiedensohler, A. (2011). Hygroscopic properties of aerosol particles at high relative humidity and their diurnal variations in the North China Plain. Atmospheric Chemistry and Physics Discussions, 11 (1), 2991-3040. doi:10.5194/acpd-11-2991-2011.
Mannucci PM. (2015). Effects on health of air pollution: a narrative review. Internal and Emergency Medicine, 10, 657-662.
Marx, R. W., Blumenfeld, P.C., Krajack, J.S, Fishman, B., Soloway, E., Geier, R., & Revital, T. T. (2004). Inquiry-based science in the middle grades: Assessment of learning in urban systemic reform. Journal of Research in Science Teaching, 41(10), 1063-1080.
McKinstry, J., & Chowdhury, Z. (2015). Mitigation strategies for a changing climate in National City. The Sage Project at San Diego State University: San Diego, CA. Available at: https://digitallibrary.sdsu.edu/islandora/object/sdsu%3A4984 [25]. (accessed 24 November 2018)
Menon, S., Hansen, J., Narazenko, L., Luo, Y. (2002). Climate effects of black carbon aerosols in China and India. Science, 297, 2250-2253.
Monteverde, K., & Novak, A. (2016). A geospatial perspective on community development. Presented at the San Diego State University 2016 Student Research Symposium, San Diego, CA.
Nadadur, S. S., & Hollingsworth JW. (2015). Air pollution and health effects. London, England: Springer; 2015.
Nowack. B. & Bucheli, T.D. (2007).Occurrence, behavior and effects of nanoparticles in the environment.Environmental Pollution, 150 (1), 5-22.
Onset Computer Corporation. (2016). HOBO U12 Temperature/Relative Humidity/2 External Channel Data Logger: User’s manual. Retrieved from http://www.onsetcomp.com/products/data-loggers/u12-013(accessed 24 November 2018)
Rivet, A., & Krajcik, J. (2004). Achieving standards in urban systemic reform: An example of a sixth grade project-based science curriculum. Journal of Research in Science Teaching, 41(7), 669-692.
Schlossberg, M. A., & Larco, N. (2013). The Sustainable City Year Program: A new, radically simple model for publicly engaged scholarship. Public: A Journal of Imagining America, 1(1 & 2). Retrieved from: http://public.imaginingamerica.org/blog/article/the-sustainable-city-year-program/
Schlossberg, M., Larco, N., Slotterback, C. S., Connerly, C., & Greco, M. (2018). Educational Partnerships for Innovation in Communities (EPIC): Harnessing university resources to create change. In A. I. Frank & C. Silver (Eds.), Urban planning education: Beginnings, global movement and future prospects(pp. 251-268). Cham, Switzerland: Springer International Publishing.
Sioutas, C., Kim, S., Chang, M.C., Terrell, L.L., Gong, H. (2000). Field evaluation of a modified dataram mie scattering monitor for real-time PM2.5 mass concentration measurements. Atmospheric Environment, 34, 4829–4838.
Suter, A. (1991). Noise and its effects. Administrative Conference of the United States. Retrieved from: http://www.nonoise.org/library/suter/suter.htm
TSI Incorporated. (2012). DustTrak DRX in environmental applications (EXPMN-006) A4. Available at: http://www.tsi.com/DUSTTRAK-DRX-Aerosol-Monitor-8534/ [26](accessed 24 November 2018).
U.S. Census Bureau (2016). Quickfacts National City, California. Available at: http://www.census.gov/quickfacts/fact/table/nationalcitycitycalifornia/HSG010216 [27] (accessed 24 November 2018).
U.S. EPA. (1974).Information on levels of environmental noise requisite to protect public health and welfare with an adequate margin of safety. EPA Doc ID#550/9-74-004. Washington, D.C. https://nepis.epa.gov/Exe/ZyPDF.cgi/2000L3LN.PDF?Dockey=2000L3LN.PDF(accessed 24 November 2018).
U.S. EPA. (2016). Air Quality Guide for Particle Pollution. Available at:https://airnow.gov/index.cfm?action=pubs.aqguidepart (accessed 24 November 2018).
U.S. EPA. (2018). Status of California Designated Areas. Available at: www3.epa.gov/airquality/urbanair/sipstatus/reports/ca_areabypoll.html (accessed 24 November 2018).
U.S. EPA. (2018) Research on health and environmental effects of air quality. Available at: https://www.epa.gov/air-research/research-health-and-environmental-effects-air-quality. (accessed 24 November 2018).
Williams, M., & Linn, M. (2002). WISE Inquiry in fifth grade biology. Research in Science Educations, 32(4), 415-436.