 [1]
[1]
Pope Part 1 JSE Water March 2020 PDF [2]
Link to JSE March 2020 Water and Climate Issue Table of Contents [3]
Abstract: Part One of a two-part article outlines a brief history of showering and questions current showering practices. Current global levels of water use and availability are discussed, plus water use in the United States, relative to Americans’ frequency of showering. The energy requirements for cities to provide clean water is outlined as well as the carbon dioxide emissions that are subsequently released during water delivery and wastewater disposal. In Part Two, water conservation through graywater use and rainwater harvesting is described, and sustainable methods of heating water are offered. Possible methods for water filtration and purification are presented. The feasibility of alternatives for a more sustainable shower is addressed. Both articles conclude with an invitation to students and instructors to collaborate with the author to construct a prototype of an off-grid recirculating shower.
Introduction
The purpose of this article is to increase understanding of our relationship with water and to investigate the potential of constructing an economically feasible, passively heated, solar-powered recirculating shower, thereby discovering what is required to reuse water continuously while significantly reducing water usage. By improving knowledge about water resource use, can a collaborative effort between students from multiple schools encourage a design effort of potential benefit to many? The eventual goal is to provide one or more designs that extract as little water as possible, while providing a level of comfort not otherwise available using conservation methods alone.
The concern over global water resources, their quantity and quality, has been expressed for decades (N.W. Arnell, 1999; P.E. Waggoner, 1990). Yet a report by the Yale Project on Climate Change Communication has shown that there are “important gaps in knowledge and common misconceptions about climate change and the earth system” (Leiserowitz, 2010). Leiserowitz states that 75% of people surveyed on the subject recognized that they have a gap in their understanding. The time for addressing those gaps is at a critical moment. Adjustments in resource use may determine the continued viability for many species on this planet. We can no longer assume access to water is something to take for granted. Water use (and reuse) in the next century will out of necessity be different than it has been in the past; in the future there will be no such thing as waste-water. A summary is presented here regarding water resource use and how it relates to showering in the future. Curriculum can be enhanced with the inclusion of this summary as it highlights current use, reuse, and waste.
Martin et al. (2016) ask, when we will “shift from the current ‘age of plunder’ toward an ‘age of respect’ that accepts a world governed by biophysical limits?” (p. 6108). Changing ingrained values and habits can make us feel like we have lost control and cause us to choose to stay on a path of degradation and despair rather than choose an unfamiliar pattern, no matter how inspiring (Kanter, 2012). Most feel that water conservation is a great idea, but few want to actually change to address it (Xeros, 2015). We must address the “disconnect” between developing knowledge and inspiring action (Crookall & Thorngate, 2009).
It’s critical to embrace sustainable practices now in order to avoid “Day Zero,” a day when we face no access to public water utilities. If we think ahead, our transition to the future can be uplifting and inspiring, and provide us with functional alternatives instead of despair and deprivation. There may be many “Day Zeros” ahead regarding our relationship to the planet, but the goal of sustainability is to dance the line that avoids all Day Zeros.
This article (Part One) is divided into the following sections:
- A Brief History of Bathing and Showering
- Water Use Awareness in the U.S. and Worldwide
- To Shower or Not to Shower?
- Relationship of Water to Energy and CO2 Emissions
- Water Conservation Through Graywater Use
1. A Brief History of Bathing and Showering
Pakistan hosts a site of one of the earliest public baths known: The Great Bath of Mohenjo-daro, built in the 3rd millennium BCE (Bushak, 2015). In 2000 BCE, the Babylonians were the first to invent soap as we’re currently familiar with it. For the ancient Egyptians, their “soap” consisted of a scented paste of ash and clay (Bushak, 2015). The ancient Greeks were the first to develop showers with water running through lead pipes (Bushak, 2015). Ancient Romans expanded on this Greek invention with an aqueduct system supplying indoor water to public bath houses, where people met and socialized.
Throughout the Middle Ages, Turks and Arabs maintained a practice of daily baths. European Roman bathhouses fell largely into disrepair, exacerbated by the rise of Christianity, which viewed frequent bathing as an act of vanity (Bushak, 2015). Nevertheless, the European rich continued regular private bathing as well as social bathing, and a soap industry emerged in England as a result (Bushak, 2015). Although it may be reasonable to consider the daily shower as a recent trend, the need to bathe has been with humanity for millennia.
In the middle of the 19th century, middle-class homes began to have bathrooms. It was considered a luxury into the early 20th century, with working-class people first acquiring in-home bathrooms around 1900-1920 (Lambert, 2017). Although Americans generally assume that everyone must surely have a bathroom in this century, more than 1.6 million Americans still do not have indoor plumbing (Ingraham, 2014). Today, the average American showers at least once a day, perhaps more (Bushak, 2015). Since bathing in general is not associated just with health benefits, but to relax, reduce stress, relieve aching muscles, and as a sleep aid (Bushak, 2015), how should bathing be viewed in the future? We need a plan that can get showers to the 1.6 million currently without them, while making showering for the rest less water-intensive and energy dependent.
2. Water Use Awareness in the U.S. and Worldwide
The world’s population is growing at a rate of 80 million people per year. We can expect that there will be an increased demand for fresh water of about 60 million cubic meters per year (Muthukumaran et al., 2011). We use 10 billion tons of freshwater worldwide everyday (The World Counts, 2014). Water withdrawals for the United States are estimated to be 408 billion gallons of water per day, or 1,430 gallons per capita per day, among the highest in the world (Griffiths-Sattenspiel & Wilson, 2009). Kincaid (2015) reports that according to the United States Geological Survey (U.S.G.S.), the average American uses 88 gallons of water per day… perhaps because water is readily available to most. People in many other countries use much less. If we had to collect and transport our own water perhaps those patterns would change.
Water is scarce for 20% of the world’s population and 25% don’t have access to water due to the lack of appropriate infrastructure (Kincaid, 2015). The United Nations has estimated that 50 countries will face water shortages by 2025 (The World Counts, 2014). In Australia the increase in demand translates to a need for 33%-58% more water (Muthukumaran et al., 2011).
According to a 2016 study, freshwater withdrawals will increase due to a 30% increase in population in the United States by 2060. Decreased precipitation and increased temperatures will result in greater plant evapotranspiration (Garcia-Cuerva et al., 2016). Currently, the average global water footprint per person is approximately 1,240 m3 (327,573 gal), whereas the amount used per person in the United States is double the world average at 2,483 m3 (655,940 gal) (Xeros, 2015). However, some estimates are 80-100 gal per day (365,000 gal) for average U.S. consumption (USGS, 2016).
The U.S. Government Accountability Office has reported that 40 out of 50 states will face some form of water shortage within the next decade (Kincaid, 2015). According to Kincaid (2015b):
- Due to the drought and reduced snowpack in California, residents will pay high fines if they exceed their regulated water quota;
- Water demand and availability in Montana is so erratic that the state is likely to go into crisis in the next few years;
- Raising sea levels contaminate fresh water with salt-water in Maryland, making available water no longer potable;
- In Colorado (as well as many other states), fracking causes contamination to some of their water supply;
- Between 2000 and 2030 the population in Arizona and Nevada will more than double and these states have among the lowest rainfall levels in the country.
According to Gusovsky (2016), the EPA reported that “only nine U.S. states have safe levels of lead in their water supply. These include Alabama, Arkansas, Hawaii, Kentucky, Mississippi, Nevada, North Dakota, South Dakota and Tennessee.” This means that not only are we running out of water, what we do have is becoming more polluted.
In Cape Town, South Africa, the year of 2018 began with the government providing notice that April 12 would be “Day Zero” – the day when water supplies were expected to be too low to deliver potable water to its residents (Wilson, 2018). As of February 2018, their water supply was expected to last only months, making Cape Town the first major city in the world to run out of water due to “poor planning, three years of drought and spectacularly bad crisis management” (Baker, 2018). The city implemented phased water restrictions: phase one imposed a 23-gallon limit of water per person per day, quickly reduced to 13-gallons and eventually to 6.6 gallons (50 liters) per person per day (Baker, 2018). The city recommended the following personal water distribution amounts:
- 10 liters (2.6 gal) to shower including hair washing (5 liters if no hair wash; sponge bath = 3 liters). That represents about 2 minutes in the shower using the most water-saving showerhead currently available at 1.25 gal per minute (A Great Shower, 2014); and no waiting for the water to get hot first!
- 9 liters (2.38 gal) to flush the toilet per flush. If using graywater = 0 liters.
- 2 liters (0.53 gal) to brush teeth and wash hands. Waterless sanitizer = 0 liters.
- 1 liter (0.27 gal) for a small to medium sized pet.
- 9 liters (2.38 gal) to wash dishes by hand or one economy load in a dishwasher every 3 days (27 liters).
- 3 liters (0.79 gal) for drinking (water, coffee, tea) per day.
- 1 liter (0.27 gal) for food prep and cooking per day.
- 5 liters (1.32 gal) for house cleaning every other day. Waterless products = 0 liters.
- 10 liters (2.6 gal) provides enough for 1 washing machine load per week for laundry, or 9 liters for hand washing per day (Let’s Beat Day Zero, 2017).
These amounts were only recommendations, so some wealthy Cape Town citizens were undeterred by the $41 to $248 fines for excessive water use. However, others in the community adjusted appropriately, and stated, “Come Day Zero, there is no way I am going to flush more than a third of my precious daily water supply down a conventional toilet” (Baker, 2018). They went online to purchase dry composting toilets, hoping that the sites were not sold out (Baker, 2018).
It is time for us to really think about our personal water usage. In a study with Greek and Polish participants, it was the children and the male adults that took the shorter showers, and the children took fewer showers than the adults (Shan et al., 2015). Most had not even tried to take shorter showers. When asked to estimate their personal water usage, respondents gave very low estimates (Shan et al., 2015). Although women are pictured as the ones that linger in the shower, on average they only spend an additional 39 seconds over men. Most women (71%) take showers less than 10 minutes long, and 26% are in the shower 5 minutes or less (Gillespie, 2009). Men are only slightly better at 75% and 30% respectively. Age makes a difference. Those over 55 shower 8 min 41 seconds on average, whereas people 18 to 24 take 13 min 26 seconds to complete their morning shower (Gillespie, 2009). Are mature people less cautious about hygiene, are they more efficient, or are they the ones that are concerned about conservation?
Before the 1990s, most showerheads delivered at least 5 gallons-per-minute (gpm) to the showerhead, but now Federal mandates allow no more than 2.5 gpm (Shower and Bath, n.d.). Some feel that low flow rates can lead to longer showers, but studies have shown little relationship between the flow rate and the duration of the shower (Shower and Bath, n.d.).
In many parts of the world, water usage is included in the rental of an apartment. As a result, those people that live in apartments tend to use more water than residents that occupy houses (Köhler, 2017).
In general, showers are better than baths because they have the potential to use less water. An average bath uses 80 liters of water. An electric showerhead pumps out only 6 liters a minute, but if a power shower is used, up to 15 liters per minute are thrust upon its recipient (Gillespie, 2009). Therefore, time in the shower and what kind of showerhead you use makes a difference in the amount of water that it used.
Schoenbauer et al. (2012) studied residential hot water use and found that 88% of all hot water draws were less than 5 seconds and that 91% of all draws were such that the hot water never reached the faucet. In other words, it is a habit to turn on the hot water, even when it is not really needed.
Portland, Oregon, often leads technological as well as progressive infrastructural innovation when it comes to water conservation. However, it is challenged by a population growth of 1.1% per year (Straus et al., 2016). Although it has a temperate climate and generous precipitation during much of the year, the summer is getting hotter, drier and longer in length (Chang & Jung, 2010), resulting in increased consumption and decreased supply. Even the Portland Metropolitan area will inevitably experience water shortages (Chang et al., 2014; Larson et al., 2013).
Greater demands may be placed on those parts of the world that currently have adequate water. If Oregon, for example, were to adopt water conservation methods and water reuse options, it would have water that could be shared to neighboring states that have less access to water reserves. Cities and countries with adequate or excess water for even part of the year can change habits to conserve for periods of drought instead of draining reserves. It is all a matter of how we think, and our ability to change and get our governments on board.
3. To Shower or Not to Shower?
Perhaps a place to start is in how many showers we take. Americans tend to shower frequently, often every day, whereas the British, Chinese and Japanese shower about 5 times a week (Khazan, 2015). The people of Brazil and Columbia, perhaps due to the tropical climate, shower more than once a day (Khazan, 2015).
If use of the shower is one of the most water-intensive activities in our homes, perhaps we need to consider our shower and hair-washing frequency. Many of us lead a relatively sedentary life, and we are probably showering too often. Our skin would be healthier if we avoided the daily shower (How Often, 2018). When our lifestyles involve close contact with others, for example on a bus or near people during the flu season, or frequent workouts in the gym, more frequent showers may be necessary (How Often, 2018). But, apparently, our showering habits could be reduced to two out of three days, every other day, or even once a week and it would be just fine (Palmer, 2018). This allows our skin to return to a more natural, acid-balanced pH state. A simple sponge bath for those more smell-related areas is all that is needed (How Often, 2018).
Dr. C. Brandon Mitchell, assistant professor of dermatology at George Washington University says excessive washing removes natural oils and immune system-supporting bacteria, and that most people over-bathe (Heid, 2016). Erman (2015) and Palmer (2018) agree that we should not bathe every day, especially babies and toddlers who through exposure to an array of bacteria are able to build a strong immune system and a healthy, more resilient skin. Palmer (2018) adds that also as we age, showering frequency should be diminished, so that the skin is less sensitive (Erman (2015).
It’s difficult to write about shower frequency because there is very little research regarding this topic, but the complex human skin biome is clearly damaged with frequent showering (Letzter, 2017). We may think we are protecting ourselves from harmful bacteria, but just the opposite is the case. Showering changes the pH of our skin, leaving skin more susceptible to bacterial and viral invasion (Palmer, 2018).
The same goes for our hair care. According to Kincaid (2015a):
- If hair and skin are normal to dry, washing hair once or twice a week is adequate. If greasy conditions exist, washing hair more often may be needed.
- If hair texture is coarse or curly, shampoo once per week, but fine hair will require washing twice or more per week.
- If hair is processed or damaged due to styling, it will require more frequent washing.
The main reason we over-bathe is due to societal norms (Miller, 2015). More research is necessary so that we can adjust our views and bathe appropriately. Primarily, we need to keep our hands and faces clean, encourage more sponge baths, and skip the daily shower (Letzter, 2017). Perhaps our next vacation should be a shower-free one, and when we return home, our body will be on its way to adjusting to a normal healthy skin biome and new routine.
4. Relationship of Water to Energy and CO2 Emissions
When we think about water, we fail to recognize the amount of energy needed to get the water to us, to purify it, and to deal with the wastewater (Okamoto et al., 2015). In the United States, water-related energy use represents 13% of the nation’s electricity consumption (Griffiths-Sattenspiel & Wilson, 2009). CO2 emissions due to water usage represent 5% of the total emissions for the country (Wong et al., 2017). Nineteen percent of California’s electricity consumption is water related. If seawater desalinization is used, the energy requirements would be 7 times greater than that of groundwater use, and groundwater requires 30% more energy than surface water (Griffiths-Sattenspiel & Wilson, 2009). Overall, centralized water and sewer systems represent the most energy- and carbon-intensive systems (Xue et al., 2016).
As an example of energy-related expenses for water, there are two sources of water for Portland, Oregon: one is gravity-fed surface water and a secondary source is ground water. The gravity-fed source requires 570 kWh of energy per million gallons; the ground water source that is pumped up 750 feet and transported 4.5 miles uses 3,675 kWh per million gallons of water, requiring 6.5 times more energy to serve the residents (Griffiths-Sattenspiel & Wilson, 2009).
If groundwater levels drop an average of 10 feet due to increased demand and global climate change effects, the associated carbon dioxide emissions would be approximately 680,000 metric tons per year (Griffiths-Sattenspiel & Wilson, 2009). It is critical that municipal water users recognize that it takes a great deal of energy to provide clean water and then more energy to eliminate that used water (graywater) if we are to fully grasp the true costs of our water.
In Hong Kong, showers represent 40% of domestic water usage and 19% of energy consumption to heat that water (Wong et al., 2017). Wong et al. also report that 100% of wintertime showering and 90% of summertime showering use hot water, and that the average preferred temperature was 38.6 °C (101.5 °F).
Low-flow shower heads have been implemented in many parts of the country. Not only do they decrease water usage, but they also reduce CO2 emissions (Okamato et al., 2015). Developing a showerhead that provides a sense of “satisfaction of shower feeling” is essential to their success, and this is dependent upon water flow (Okamato, 2015). The new low-flow showerhead may only require an adjustment period, and once it has been used for some period of time, the normal flow showerheads will seem wasteful and unnecessary. Addressing the best possible design for showerheads could reduce both water and energy consumption.
Reducing a shower’s duration makes a difference. In a study by Binks et al. (2017), reducing showering time from 6-10 minutes to 4 minutes saved as much as 3.8 kWh per person per day. The energy and water cost savings were $37 to $500 per household per year, and if electric storage (as opposed to natural gas) was used, the savings were as much as $900 per household per year (Binks et al., 2017).
One conservation method that could be addressed by local water utilities would be to change the lack of recent, relevant information provided to its customers. Many states send their water bills quarterly or trimesterly. How can a pattern of water usage be impacted if you receive your water bill only every 4 months (Kouroupetrogloua et al., 2015)? In the Netherlands, a townhouse development in was divided into two sections. In one section, the meters for electricity were plainly visible near the front door. In the other section, the meters were placed in the basement. There were no other differences between the townhouses, but the residents in the first section consistently used significantly less energy than those in the second. If water utility companies placed meters where clearly visible and sent monthly statements, conservation could more easily become a priority and cause water usage to drop naturally.
In addition to conservation, water reuse provides options that are more energy efficient than either desalinization or water transport strategies and that results in reduced CO2 emissions (Garcia-Cuerva et al., 2016). Water reuse can reduce demand on our freshwater systems and alleviate the nutrient and pollutant loads that are often released when wastewater reaches freshwater systems (Garcia-Cuerva et al., 2016). If energy recovery and graywater reuse systems were implemented at the individual municipal water user level, these two systems could save 14 times more energy than the current recommended conservation efforts (Xue et al., 2016)
5. Water Conservation Through Graywater Use
There are many ways to conserve water. One is through reuse of previously used water. This recycled water is called graywater (or greywater in the United Kingdom). It is usually sourced from minimally used water from bathroom sinks, showers, bathtubs and washing machines (About Greywater, n.d.). It is water that has not come into contact with feces or diaper washing; water from those sources is termed blackwater (About Greywater, n.d.). Graywater should not be stored more than 24 hours in order to prevent odors from forming, and when moving it through any storage system by gravity, a 2% slope is recommended (1/4 inch for each foot of pipe) with woodchip mulch basins to prevent clogging (About Greywater, n.d.).
Graywater accounts for about 70% of the effluent in conventional sewer systems (Xue et al., 2016). If graywater were used, it would dramatically reduce the stress on our wastewater treatment systems and protect drinking water resources (Xue et al., 2016). Due to challenges around health and safety concerns, graywater use is banned in many states, and since most households have not been designed for water reuse, there are difficulties in making the transition to graywater use as a more sustainable option (Griffiths-Sattenspiel & Wilson, 2009).
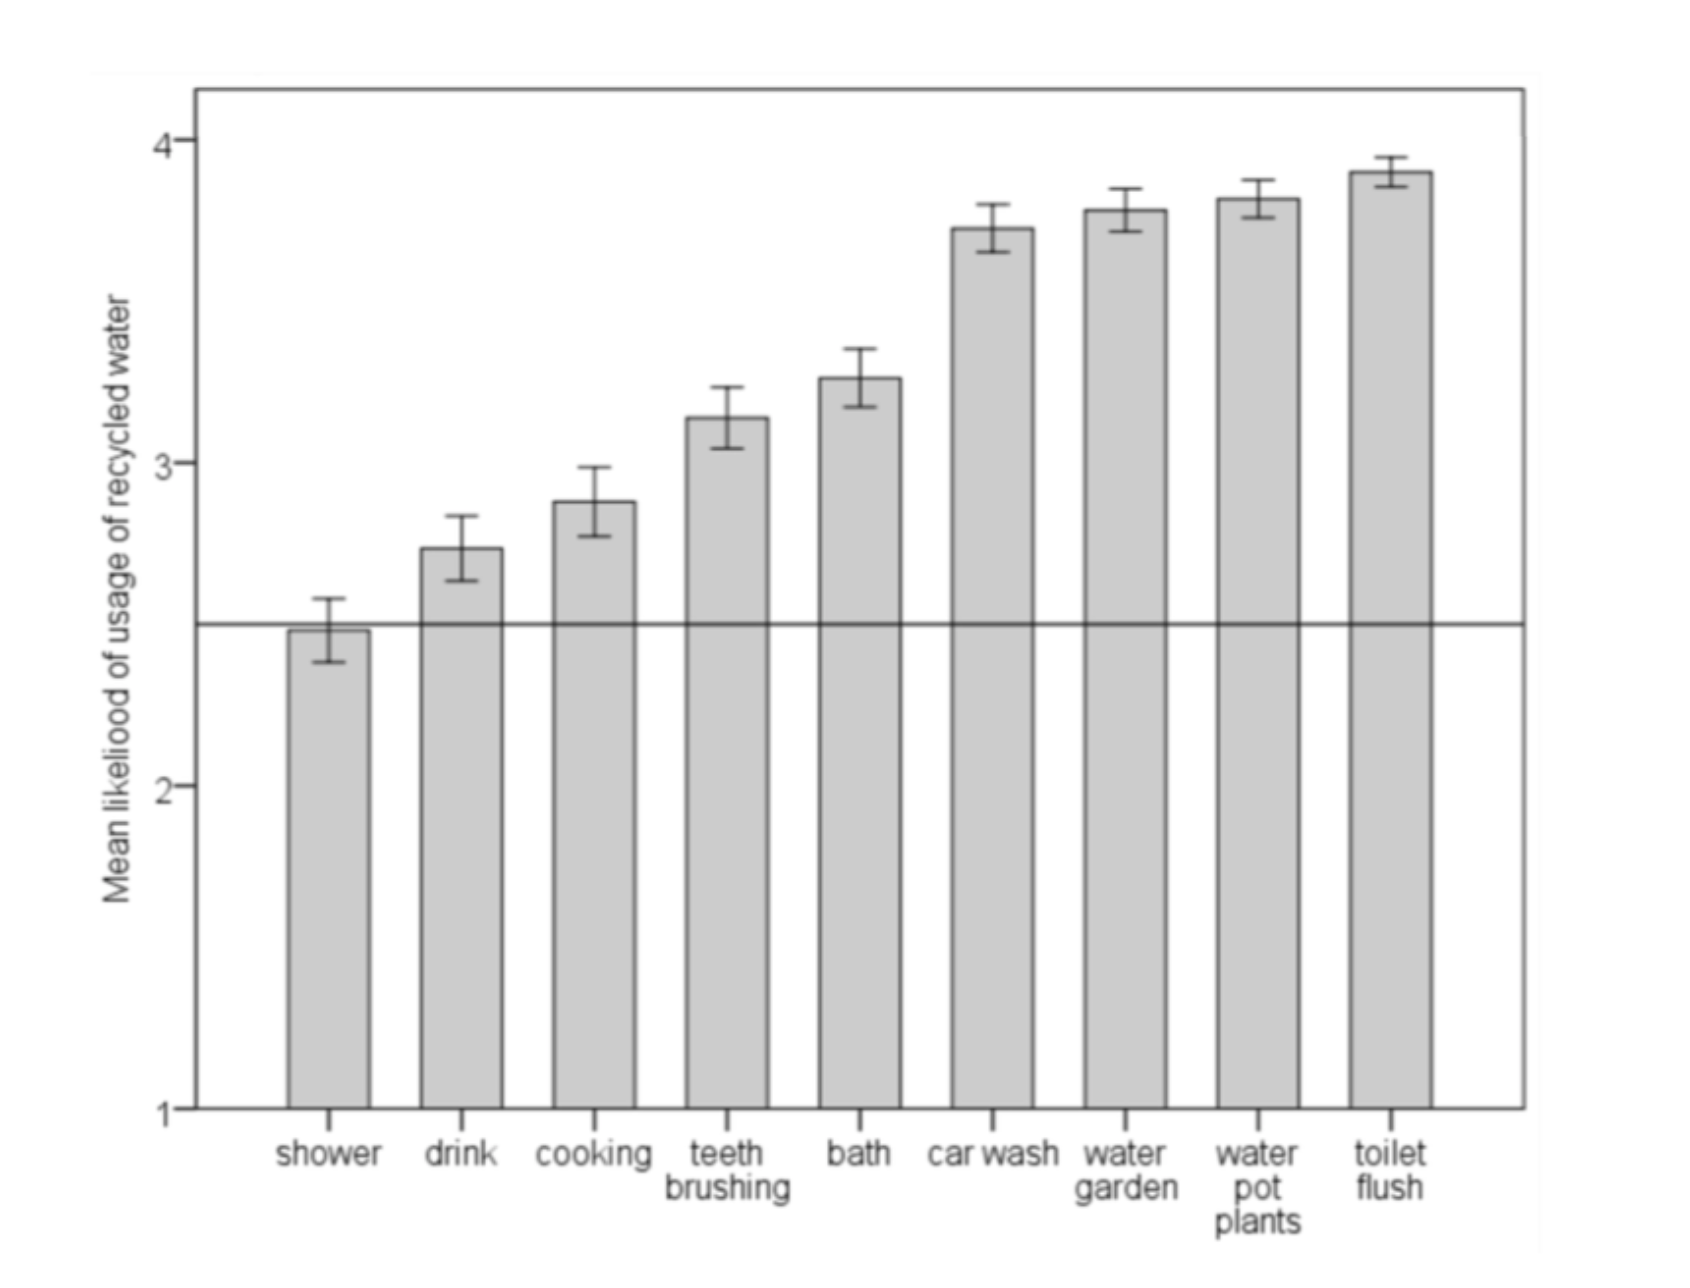
Stress on water supplies due to freshwater consumption can be alleviated with the use of graywater (Benami et al., 2016). There are some concerns about transmittal of pathogens that could be hazardous to human health. But in the study by Benami et al. (2016), health risks seem very low from aerosolized bacterial pathogens. Maimon & Gross (2017) agree that graywater reuse does not pose any additional risk if established guidelines are followed, such as monitoring the pH, total suspended solids, and turbidity. Additional studies are needed in this area because it is primarily the social-acceptance factor that prevents the public from embracing graywater reuse (Schmid & Bogner, 2018). In the study by Schmid and Bogner (2018), it was not surprising that results showed preferential uses for graywater to be toilet flushing, watering potted plants and gardens, and washing the car. Bathing, teeth brushing, and cooking were next. The surprising factor was that preference for drinking recycled wastewater came before showering with it (Figure 1). (Schmid and Bogner, 2018).
Care must be taken with untreated graywater because, in addition to pathogens, it can contain residual chemicals from surfactants, oils, greases, elevated salinity and sodicity, plus suspended solids or changes in pH (Schmid & Bodner, 2018). For the most part, however, there is no detrimental effect from ordinary residual chemicals, and plants can often benefit from the nutrients and organic carbon present in graywater (Schmid & Bodner, 2018).
It might surprise some that 13%-65% of graywater from Los Angeles has been used for irrigation of agricultural crops (Juan et al., 2016), and South Korea, Malaysia and Brazil are processing graywater. The residents of Japan would like to implement graywater systems, but the government is not supportive. In India, the payback period to cover the costs of installation for a vegetable irrigation and toilet flushing greywater system was only 1.6 years (Juan et al., 2016). When a drain-water heat-recovery system and water flow limiter were installed for a shower in Poland, the payback period was only a month. And, in Mexico, a graywater system was cheaper to operate than a rainwater recycling system (Juan et al., 2016).
 [4]
[4]Figure 1. Recycled water reuse by preferences Retrieved from Schmid and Bogner. (2018). What Germany’s University Beginners Think About Water Reuse. Water. 10, 731; doi: 10.3390/w10060731
Graywater filtration in a Taiwanese shower included a collection tank under the shower, and a polypropylene filter to remove “fine sand, mud, rust, microorganisms from the water” (p.5). The next filter was granular activated charcoal to remove chemical substances, unpleasant colors and odors. The final filter was a mesh activated- charcoal to absorb “unpleasant color, odor, chlorine gas, bleach, pesticides and organic chemical pollutants” (p.5). The water was finally sterilized with an ultraviolet anti-bacterial light (Juan et al., 2016).
Some articles discuss reclamation of polluted water (Sidhu et al., 2014). The difference between reclaimed water (RW) and graywater (GW) is significant. The RW may contain many pollutants, pesticides, and endocrine-disrupting chemicals. These compounds are never found in typical shower water unless the user works in an agricultural line of business and brings the chemicals home inadvertently. When reusing water, it is important to consider what has been added to the water previously. That will determine the filtration system and for what purpose the water can be used again.
Social acceptability is the limitation that most hinders development of graywater systems. This social reluctance is termed “physiological repugnance” by Bruvold & Ward (1972) or the “yuck factor” by Russell & Lux (2009). The main driving force for change happens when water is scarce (Garcia-Cuerva et al., 2016). Although severe droughts influence our water concerns, they have not inspired us to change and seriously address the issue through greater conservation efforts. A question we should ask is will we have to run out of water before we put logical systems in place? What will it take to get us involved in water reuse programs and turn knowledge into action?
Conclusion
Obviously, at some point we will all have to address our excessive use of water. Will we have to follow in the footsteps of Cape Town when it comes to water rationing standing in line, watched by armed guards to get our daily share? How will our lifestyle have to change just to obtain minimal water for the day, every day? The most reasonable approach is to implement conservation methods to save and reuse water now.
There is a great need for functional designs of a recirculating shower. Houseless communities often have no access to running water. Recirculating showers could benefit communities such as Flint, Michigan, where the water quality is unacceptable and where changes in quality are not anticipated in the foreseeable future (Butler et al., 2016). Native Americans could benefit as well, as reservation water supplies are frequently of inadequate quality and quantity (Kaljur & Beheler, 2017). Recirculating showers would be beneficial for places like San Diego where water supplies are so low that the city has approved the use of blackwater recycling in order to generate enough drinking water (Smith, 2017). In many parts of the world water must be hand carried to local villages. It is entirely possible to address water quality and quantity in a more equitable fashion for everyone worldwide. The design of extremely water-efficient systems is the beginning of that process.
In summary, this article represents the current literature regarding the many aspects that must be considered regarding water resources and reuse. I would like to invite teachers, instructors, and professors to participate in a collaboration to build the first recirculating shower. This literature review does not include prototypical work that has already been built. After each system is optimized, successfully integrating these systems into the most functional shower design possible will be the final step. Obviously, keeping costs to a minimum is essential. Contact the author if you would like your students to be involved in the development of part of this project.
References Cited
Arnell, N.W. (1999). Climate change and global water resources. Global Environmental Change 9: PP. S31-S49.
Baker, Aryn. (2018). What It’s Like to Live Through Cape Town’s Massive Water Crisis. Time Magazine. Retrieved from http://time.com/cape-town-south-africa-water-crisis/ [5]
Binks, Amanda N., Steven J. Kenway, Paul A. Lant. (2017). The effect of water demand management in showers on household energy use. Journal of Cleaner Production. Retrieved from https://www.sciencedirect.com/science/article/pii/S0959652617308557 [6]
Bruvold, W., Ward, P., 1972. Using reclaimed wastewater—public opinion. J. Water Pollut. Control Fed. 44 (9), 1690–1696.
Bushak, Lecia. (2015). A Brief History of Bathing: The Importance of Hygiene, From Ancient Rome’s Sophisticated Showers to The Modern Day. The Grapevine. Medical Daily. Retrieved from https://www.medicaldaily.com/brief-history-bathing-importance-hygiene-ancient-romes-sophisticated-showers-modern-364826 [7]
Butler, Lindsey J., Madeleine K. Scammell, and Eugene B. Benson. (2016). The Flint, Michigan, Water Crisis: A Case Study in Regulatory Failure and Environmental Justice. Environmental Justice Vol. 9, No. 4. https://doi.org/10.1089/env.2016.0014 [8] Retrieved from https://www.liebertpub.com/doi/abs/10.1089/env.2016.0014 [9]
Chang, H., & Jung, I. (2010). Spatial and temporal changes in runoff caused by climate change in a complex large river basin in Oregon. Journal of Hydrology, 388(3–4), 186–207.
Chang, H., Praskievicz, S., & Parandvash, H. (2014). Sensitivity of urban water consumption to weather and climate variability at multiple temporal scales: the case of Portland, Oregon. International Journal of Geospatial and Environmental Research, 1(1). Article 7
Crookall, D. and W. Thorngate, Editors. (2009). Acting, Knowing, Learning, Simulating, Gaming. Simulation and Gaming. Vol. 40 Number 1. Sage Publication. PP.8-26. Retrieved from https://journals.sagepub.com/doi/pdf/10.1177/1046878108330364 [10]
Garcia-Cuerva, Laura, Emily Z. Berglund, Andrew R. Binder. (2016). Public perceptions of water shortages, conservation behaviors, and support for water reuse in the U.S.. Resources, Conservation and Recycling. Volume 113, October. Retrieved from https://www.sciencedirect.com/science/article/pii/S0921344916301434 [11]
Gillespie, Ed. (2009). Let’s Talk Dirty … How Long Do You Spend in the Shower? The Guardian. Retrieved from https://www.theguardian.com/environment/green-living-blog/2009/sep/04/power-shower-blog [12]
Griffiths-Sattenspiel, Bevan and Wendy Wilson. (2009). The Carbon Footprint of Water. River Network, Portland, OR. Retrieved from https://www.rivernetwork.org/wp-content/uploads/2015/10/The-Carbon-Footprint-of-Water-River-Network-2009.pdf [13]
Gusovsky, Dina. (2016). America’s Water Crisis Goes Beyond Flint, Michigan. The World’s Biggest Risks. CNBC. Retrieved from https://www.cnbc.com/2016/03/24/americas-water-crisis-goes-beyond-flint-michigan.html [14]
How Often Should You Shower? (2018). Med-Health.net. Retrieved from http://www.med-health.net/How-Often-Should-You-Shower.html [15]
Ingraham, Christopher. (2014). 1.6 Million Americans Don’t Have Indoor Plumbing. Here’s Where They Live. The Washington Post. Retrieved from https://www.washingtonpost.com/news/wonk/wp/2014/04/23/1-6-million-americans-dont-have-indoor-plumbing-heres-where-they-live/?utm_term=.dc46f13f5108 [16]
Juan, U., Y. Chen, and J. Lin. (2016). Greywater Reuse System Design and Economic Analysis for Residential Buildings in Taiwan. Water. 8, 546; doi:10.3390/w8110546. Retrieved from www.mdpi.com/2073-4441/8/11/546/pdf [17]
Kaljur, Lauren and Macee Beheler. (2017). Native American tribes fight for clean water and more money. Troubled Water. Retrieved from https://troubledwater.news21.com/native-american-tribes-fight-for-clean-water-and-more-money/ [18]
Kanter, Rosabeth Moss. (2012). Ten Reasons People Resist Change. Change Management: Harvard Business Review. Retrieved from https://hbr.org/2012/09/ten-reasons-people-resist-chang.html [19]
Khazan, Olga. (2015). How Often People in Various Countries Shower. February 17.
The Atlantic. Retrieved from https://www.theatlantic.com/health/archive/2015/02/how-often- people-in-various-countries-shower/385470/ [20]
Kincaid, Ellie. (2015a). The Truth About How Often You Should Wash Your Hair, According to Science. Business Insider. Retrieved from https://www.businessinsider.com/how-often-should-i-wash-my-hair-2015-3 [21]
Kincaid, Ellie. (2015b). California Isn’t the Only State with Water Problems. Business Insider. Retrieved from https://www.businessinsider.com/americas-about-to-hit-a-water-crisis-2015-4 [22]
Köhler, Helena. (2017). Individual metering and debiting (IMD) in Sweden: A qualitative long-term follow-up study of householders’ water-use routines. Energy Policy. 108 (2017) 344–354. Retrieved from https://www.sciencedirect.com/science/article/pii/S0301421517303592?via%3Dihub [23]
Kouroupetrogloua, Christos, Maarten Piso, Wassim Derguech, Edward Curry, Jan Mink, Diego Reforgiato Recupero, Massimiliano Raciti, Jesse van Slooten, and Daniel Coakley. (2015). Engaging users in tracking their water usage behavior. 13th Computer Control for Water Industry Conference, CCWI 2015. Procedia Engineering. 119. Pp. 788-797. Retrieved from https://www.sciencedirect.com/science/article/pii/S1877705815026077 [24]
Lambert, Tim. (2017). A Brief History of Baths and Showers. Retrieved from http://www.localhistories.org/washing.html [25]
Larson, K., Polsky, C., Gober, P., Chang, H., & Shandas, V. (2013). Water education for sustainability: criteria and recommendations. Society & Natural Resources, 27(11), 1213–1222.
Leiserowitz, A., Smith, N. & Marlon, J.R. (2010) Americans’ Knowledge of Climate Change. Yale University. New Haven, CT: Yale Project on Climate Change Communication. http://environment.yale.edu/climate/files/ClimateChangeKnowledge2010.pdf [26]
Let’s Beat Day Zero. (2017). 50 Litre Life Poster. http://resource.capetown.gov.za/documentcentre/Documents/Graphics%20and%20educational%20material/50%20Litre%20Life%20Poster-colour.pdf [27]
Letzter, Rafi. (2017). You’re Probably Showering Way Too Often. Business Insider. Retrieved from https://www.businessinsider.com/how-often-should-you-shower-science-2017-1 [28]
Maimon, A., and A. Gross. (2017). Greywater: Limitations and perspective. Current Opinion in Environmental Science & Health. Vol. 2, April 2018, 1-6. doi.org/10.1016/j.coesh.2017.11.005. Retrieved from https://www.sciencedirect.com/science/article/pii/S246858441730020X?via%3Dihub [29]
Martin, Jean-Louis, Virginie Maris, and Daniel S. Simberloff. (2016). The need to respect nature and its limits challenges society and conservation science. PNAS. Volume 113, No. 22. Pp 6105-6112. Retrieved from https://www.rivernetwork.org/wp-content/uploads/2015/10/The-Carbon-Footprint-of-Water-River-Network-2009.pdf [13]
Miller, Rachel Wilkerson. January 12, 2015. How Often You Really Need to Shower (According To Science). Buzz Feed. Retrieved from https://www.buzzfeed.com/rachelwmiller/how-often-you-really-need-to-shower?utm_term=.kk89ovJyX#.peJKG6d79 [30]
Muthukumaran, Shobha, Kanagaratsam Baskaran and Nicole Sexton. (2011). Quantification of potable water savings by residential water conservation and reuse – A case study. Resources, Conservation and Recycling. 55: 945-952.
Okamoto, Minami, Minoru Sato, Yoshihiko Shodai, and Masayoshi Kamijo. (2015). Identifying the Physical Properties of Showers That Influence User Satisfaction to Aid in Developing Water-Saving Showers. Water. 7, 4054-4062; doi:10.3390/w7084054.
Palmer, Angela. July 17, 2018. VeryWellHealth. Retrieved from https://www.verywellhealth.com/how-often-should-you-shower-4154629 [31]
Russell, S., Lux, C., 2009. Getting over yuck: moving from psychological to cultural and sociotechnical analyses of responses to water recycling. Water Policy 11 (1), 21–35.
Schoenbauer, Ben, David Bohac, and Martha Hewett. (2012). “Measured Residential Hot Water End Uses.” ASHRAE Transactions 119, no. Part 1 January 2012.
Schmid, Sarah and Franz W. Bogner. (2018). What Germany’s University Beginners Think About Water Reuse. Water. 10, 731; doi: 10.3390/w10060731
Shan, Yixing, Lili Yang, Kim Perren, and Yanmin Zhang. (2015). Household Water Consumption: Insight from a Survey in Greece and Poland. 13th Computer Control for Water Industry Conference, CCWI 2015. Procedia Engineering. Vol. 119. Pp. 1409-1418. Retrieved from https://www.sciencedirect.com/science/article/pii/S1877705815026715 [32]
Shower and Bath Fact Sheet. (n.d.). Portland Water Bureau. Retrieved from https://www.portlandoregon.gov/water/article/305153 [33]
Sidhu, H. S., P. C. Wilson, & G. A. O’Connor. (2014). Endocrine-Disrupting Compounds in Reclaimed Water and Residential Ponds and Exposure Potential for Dislodgeable Residues in Turf Irrigated with Reclaimed Water. Environmental Contamination & Toxicology. 69:81–88. Retrieved from https://link.springer.com/article/10.1007%2Fs00244-015-0147-6 [34]
Smith, Joshua Emerson. (2017). San Diego will recycle sewage into drinking water, mayor declares. The San Diego Union-Tribune. May 10, 2017.
Straus, Jonathan, Heejun Chang, and Chang-yu Hong. (2016). An exploratory path analysis of attitudes, behaviors and summer water consumption in the Portland Metropolitan Area. Sustainable Cities and Society. 23. 68-77. Retrieved from http://dx.doi.org/10.1016/j.scs.2016.03.004 [35]
The World Counts. (2014). Water, Water Everywhere… But Not Drop to Drink. Retrieved from http://www.theworldcounts.com/stories/average-daily-water-usage [36]
USGS. (2016). How much water does the average person use at home per day? Retrieved from https://water.usgs.gov/edu/qa-home-percapita.html [37]
Waggoner, P.E. (1990). Climate change and US water resources. United States: N. p., 1990. Retrieved from https://www.osti.gov/biblio/5765798 [38]
Wilson, Keith. 2018. Geographical. Vol. 90 Issue 9 September, p64-67. Circle Publishing Ltd.
Wong, Ling-tim, Kwok-wai Mai and Yang Zhou. (2017). Carbon Dioxide Reduction Targets of Hot Water Showers for People in Hong Kong. Water. 9,576; doi: 10.3390/w9080576. Retrieved from http://www.mdpi.com/2073-4441/9/8/576/htm [39]
Wright, Pam and Bob Henson. (2018). Earth Day 2018: The 10 Most Pressing environmental Concerns Facing Our Planet – And Rays of Hope for Each. The Weather Channel. Retrieved from https://weather.com/science/environment/news/2018-04-18-earth-day-2018-10-concerning-things-future-of-planet [40]
Xeros. (2015). Water Use Habits are Hard to Break. Xeros Technology Group. Retrieved from http://www.xeroscleaning.com/blog/water-use-habits-are-hard-to-break [41]
Xue, Xiaobo, Troy R. Hawkins, Mary E. Schoen, Jay Garland and Nicholas J. Ashbolt. (2016). Comparing the Life Cycle Energy Consumption, Global Warming and Eutrophication Potentials of Several Water and Waste Service Options. Water, 8, 154; doi:10.3390/w8040154. Retrieved from www.mdpi.com/jpournal/water [42]