 [1]
[1]
Norton JSE April 2019 General Issue PDF [2]
Link to the JSE April 2019 General Issue Table of Contents [3]
Abstract: Household composting is a practical sustainable behavior which should be further investigated. The Short Composting Survey was developed for use during the Compost Project pilot study to measure the knowledge, values, barriers, and social norms surrounding composting (n=25). The purpose of this research was to describe the testing and refining of the survey tool for the pilot study. Statistical analyses included calculating the Index of Item-Objective Congruence (IIOC) values and conducting a confirmatory factor analysis following administration of the survey. Nine respondents assisted with survey tool development by completing the IIOC, and values ranged from 0.29 to 0.66 which indicated that all of the survey questions matched more than one construct. The factor analysis resulted in a three-factor solution with a cumulative loading of 71.2%, meaning that these identified factors contributed 71.2% of the variance in responses. Factor 1 (“Values”) proved to be the strongest factor, explaining 36.6% of the variance, whereas Factor 2 (“Social Norms”) explained 20.04%, and Factor 3 (“Barriers”) had 14.6%. This survey may be useful for future food composting and sustainability-related research efforts.
Keywords: Composting, survey, food sustainability, confirmatory factor analysis
INTRODUCTION
Efforts to address reducing food waste are needed in all community settings, including schools and workplaces. Household approaches include freezing leftovers, donating unopened packages to food banks, using vegetable scraps for soup stocks, and minimizing fresh produce purchases to what can reasonably be consumed within a certain time frame (EPA, 2017). Even if community members attempt to minimize their food waste by following these recommendations, a certain amount of waste is inevitable.
In 2010, food waste was 31 percent of the food supply, which was equivalent to 133 billion pounds (an average of 218.9 pounds of food waste per person was sent to a landfill) (EPA, 2017). Thus, in September 2015, the United States Department of Agriculture (USDA) and the Environmental Protection Agency (EPA) announced the U.S. 2030 Food Loss and Waste Reduction Goal (EPA, 2017). The federal government is aiming to reduce food waste by 50% to 66 billion pounds by 2030 (EPA, 2017). If successful, the benefits of this reduction would include reduced methane emissions, a potent greenhouse gas, from organic materials decomposing at landfill sites and less money spent on wasted food (EPA, 2017). If an individual can’t reduce food waste by following the recommendations outlined above, then composting is a reasonable method for redirecting the waste from landfills (EPA, 2017).
Composting effectively recycles organic food scraps into usable soil, and it can be done under aerobic or anaerobic conditions. At the household level, food scraps can be collected in a small container and then added to an outdoor bin or pile, fed to red wiggler worms living in a worm bin, or placed into a shallow trench and buried under soil. Community efforts to live sustainably through such approaches as composting and reducing food waste can be aided by the development of survey tools assessing the knowledge, attitudes, and perceived barriers surrounding the practice of composting.
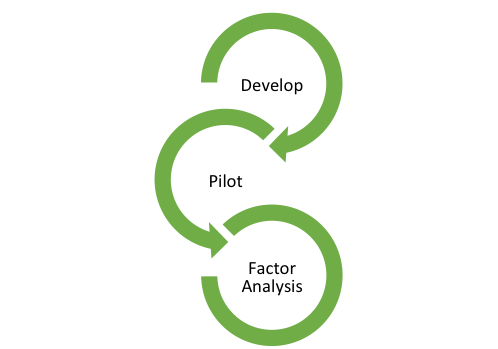
Research regarding composting interventions and their associated survey tools is limited. Therefore, it is the intent of this study to develop, pilot, and analyze the results from a short composting survey for use in future studies. As researchers develop new survey tools, a process such as the Index of Item-Objective Congruence (IIOC) may prove useful. The IIOC helps researchers determine if an item (survey question) can be matched to a particular concept, as described by Crocker and Algina (1986).
After piloting a new survey, confirmatory factor analysis may assist researchers in evaluating how well the survey tool measures the constructs of interest. Initial versions of the survey tool can be adjusted based upon participant feedback, and the next iteration of the tool can be applied to a different group of participants. If a survey question does not adequately match the construct, it can be discarded in favor of a more appropriate choice. The survey validation process assists researchers in developing tools that accurately measure their constructs of interest.
Factor analysis may be applied to a new survey tool as a method of exploring response patterns and looking for “common components among multiple dependent items” (Crocker & Algina, 1986, p.305). Gorsuch explains the goal of factor analysis as follows: “to summarize the interrelationships among the items in a concise but accurate manner as an aid in conceptualization” (1983, p.2). A tool’s intended constructs are considered factors contributing to an understanding of the tool’s object of interest. For example, a tool designed to assess participants’ attitudes surrounding physical activity behaviors might include such factors as perceived benefits and barriers, interest in various physical activities, and time spent outdoors.
Factor analysis helps a researcher determine how well a given set of items addresses the intended construct or constructs. When conducting a factor analysis, the researcher loads factors in the model to look for the “degree of generalizability” between factors (Gorsuch, 1983, p.3). Factor loadings can vary in value from -1 to 1, with values that approach -1 and 1 indicating the item has a strong relationship with the construct, and values approaching zero indicating the item appears unrelated to the construct (Deviant, 2017).
Communalities are also reported for the items, which refers to the “portion of [their] variance that is associated with variance on the common factors” (Crocker & Algina, 1986, p.295). These values range from 0 (no correlation) to 1 (perfect correlation) (Crocker & Algina, 1986). Items with communalities below 0.20 should be removed from the factor analysis because their posited items (as addressed) have less in common with the other factors, meaning that these items are less useful for the tool’s purpose (Yong & Pearce, 2013).
Participant responses are used to analyze the tool’s function via either exploratory or confirmatory factor analysis. Researchers should choose an exploratory factor analysis (EFA) when they have not yet determined the structure of the data or the number of dimensions to the items (Gorsuch, 1983). In the case of a CFA, the researchers already have an idea about the data structure and the number of dimensions to the items (Gorsuch, 1983).
Two outputs from factor analysis include the Eigenvalue and the Kaiser-Meyer-Olkin (KMO) test values. The Eigenvalue represents “the number of original values [concepts] that are associated with that factor,” and they are grouped into related factors (Crocker & Algina, 1986, p.296). This value assists the researcher in determining how many factors should be retained (Yong & Pearce, 2013). If the researcher decides to follow “Kaiser’s criterion,” all factors above an Eigenvalue of one are retained (Yong & Pearce, 2013, p.85). The KMO test measures how suitable the data is for factor analysis (Deviant, 2017). Values range from zero to one: values between 0.8 and 1.0 indicate the data is adequate for a factor analysis (Deviant, 2017). Values less than or equal to 0.6 mean a factor analysis should not be conducted, although some researchers allow for values greater than or equal to 0.5 (Deviant, 2017). If the KMO value is near zero, then widespread correlations exist and a factor analysis should not be conducted (Deviant, 2017). In such cases, participant responses indicate that a tool’s items are each addressing more than one construct (i.e. split loadings). The purpose of this research is to describe the testing and refining of the short composting survey tool used as part of a brief, supportive compost education intervention on a college campus.
METHODS
Pilot Study
The Compost Project was a brief pilot study conducted during the Fall 2017 quarter at Central Washington University (CWU) (results not published). This pilot study was designed to evaluate the effect of supported home composting on fruit and vegetable intake. The researchers developed the Short Composting Survey for use during the project in order to measure attitudes and behaviors around food and composting. Twenty-five participants were initially enrolled in the study. Participants ranged in age from 18 to 33 years old, 24 were students, and one participant was a recent graduate from CWU; faculty members and nutrition students were excluded from the study. This article relates the testing and refining of the tool during the pilot, with potential implications for future food and sustainability-related research efforts.
Short Composting Survey
At the initial study orientation meeting, participants were asked to complete the Short Composting Survey. The Short Composting Survey, a brief, researcher-developed tool, was designed to measure the aforementioned targets by asking about composting and food preparation behaviors. The results described within this article are based on the responses of participants to this initial application of the tool.
The researchers developed the Short Composting Survey for this study due to the lack of a validated survey tool pertaining to eating habits and composting. After writing the initial items, nine college-educated individuals completed the IIOC Rating Form for Composting. Following data collection, confirmatory factor analysis (CFA) was conducted to determine if the survey tool appropriately measured the concepts of values, barriers, and social norms as they related to composting and food.
Statistical Analysis
The confirmatory factor analysis was conducted with a computer with SPSS software (version 24).
RESULTS
The IIOC was calculated for each item on the IIOC Rating Form discussed above and using the following formula:
Iik = ____N____ (µk – µ)
2N -2
To solve for the formula above, N is the number of constructs, μk refers to the respondents mean rating of item i on a particular construct (k), and µ is the respondents’ mean rating of item i on all of the constructs (Crocker & Algina, 1986).
Table 1: IIOC Results
| Item | Construct | Index of Congruence |
| Thinking about what’s typical for you, how often do you compost your kitchen scraps? | Behavior | 0.66 |
| Thinking about what’s typical for you, how often do you prepare meals in your kitchen? | Behavior | 0.65 |
| Thinking about what’s typical for you, how often do you visit a garden that grows food? | Behavior | 0.44 |
| Rate your level of agreement for this statement: I don’t have time to compost. | Barriers | 0.58 |
| Rate your level of agreement for this statement: I don’t have room to compost. | Barriers | 0.53 |
| Rate your level of agreement for this statement: compost smells bad. | Barriers | 0.29 |
| Paper towel rolls can be composted. | Knowledge | 0.54 |
| Plastic bags can be composted. | Knowledge | 0.53 |
| Onion skins can be composted. | Knowledge | 0.59 |
| Rate how important it is to you that composting reduces the environmental impact of garbage. | Values | 0.62 |
| Rate how important it is to you that composting recycles kitchen scraps into garden soil. | Values | 0.62 |
| Rate how important it is to you that if people composted, we could keep about half of our garbage out of landfills. | Values | 0.53 |
| Rate your level of agreement for this statement: My friends think composting is a good idea. | Social Norms | 0.54 |
| Rate your level of agreement for this statement: Many people I know like to compost. | Social Norms | 0.56 |
| Rate your level of agreement for this statement: Many people I know visit a community garden. | Social Norms | 0.43 |
Before the confirmatory factor analysis, a KMO test was applied to the data to determine if such analysis was appropriate. The KMO test value was 0.503, indicating its suitability for factor analysis (based on a value greater than 0.5). Bartlett’s test of sphericity (p<0.0001) produced significant results, which suggests that the data has “patterned relationships” (Yong & Pearce, 2013, p.88). If Bartlett’s test results are non-significant, then the items are not sufficiently related to each other for a factor analysis to be applied to the data set (IBM, 2018).
A CFA was conducted on the data using a Varimax rotation with a Kaiser Normalization. According to Yong and Pearce, “factors are rotated [around an axis] for better interpretation since unrotated factors are ambiguous” (Yong & Pearce, 2013, p.84). The Varimax rotation is an orthogonal approach which decreases the presence of high loadings and minimizes small loadings, in effect reducing the likelihood that a researcher will report an erroneous factor structure (Yong & Pearce, 2013). Kaiser Normalization suggests retaining all factors with an Eigenvalue above one (Yong & Pearce, 2013).
This analysis resulted in a three-factor solution with a cumulative loading of 71.2%, meaning that these identified factors contributed 71.2% of the variance in responses. The individual Eigenvalues for the three factors were each greater than one, above the Kaiser’s Normalization threshold for determining meaningful contribution. The scree plot contained three points above an Eigenvalue of one, which supported the conclusion that the tool addresses three factors.
Factor 1 (“Values”) proved to be the strongest factor, explaining 36.6% of the variance, whereas Factor 2 (“Social”) explained 20.04%, and Factor 3 (“Barriers”) had 14.6% (Table 2). To determine which results are significant (i.e. which factors appear to be meaningful), the researchers conducting a factor analysis must set a cut-off value for factor loadings (Yong & Pearce, 2013). Using a cut-off value of 0.60, four out of nine items (addressed by items 1 through 4) loaded moderately or highly on Factor 1. Factor 2 was represented in two moderately loaded items (6 and 7), and Factor 3 in only one item (Table 2). Two items, as addressed by items 5 and 8, loaded below the cut-off value of 0.60.
If the cut-off value is moved to 0.50, Factor 1 is linked to seven out of nine items (1 through 6 and 8), Factor 2 to four (items 2, 6, 7, and 8), and Factor 3 to two (items 4 and 9). There are a number of split loadings in the data, in which items load at “0.32 or higher on two or more factors” (Yong & Pearce, 2013, p.84). Using the lower cut-off value of 0.50, items 1, 2, 4, 6, 7, 8, and 9 all have split loadings. This finding indicates that the factors themselves are interrelated and factor identification may be more difficult, meaning that further refinement may improve the tool’s usefulness.
Table 2: Confirmatory Factor Analysis Results
| Item | Description | F1: Values | F2: Social | F3: Barriers | Communalities |
| 1 | Composting keeps half of garbage out of landfills. | 0.777 | 0.379 | -0.283 | 0.827 |
| 2 | Many people I know like to compost. | -0.721 | 0.510 | 0.185 | 0.814 |
| 3 | Composting recycles kitchen scraps into garden soil. | 0.708 | 0.233 | -0.128 | 0.572 |
| 4 | I don’t have room to compost. | 0.681 | 0.026 | 0.532 | 0.747 |
| 5 | Compost smells bad. | 0.538 | -0.260 | -0.065 | 0.361 |
| 6 | Composting reduces the environmental impact of garbage. | 0.554 | 0.617 | -0.446 | 0.887 |
| 7 | My friends think composting is a good idea. | -0.327 | 0.604 | 0.398 | 0.630 |
| 8 | Many people I know are involved with a community garden. | -0.550 | 0.573 | -0.402 | 0.792 |
| 9 | I don’t have time to compost. | 0.444 | 0.451 | 0.614 | 0.778 |
| Eigenvalue | 3.292 | 1.804 | 1.314 | ||
| Variance explained (%) | 36.577 | 20.046 | 14.603 | ||
| Cumulative percentage (%) | 36.577 | 56.623 | 71.226 |
Item 6 has the highest communality at 0.887, followed by items 1 at 0.827 and 2 at 0.814, respectively. Gorsuch refers to communality as the “proportion of its variance that can be accounted for by the common factors” (1983, p.29). Applying this definition to the results listed above, 88.7% of the variance for item 6 is due to the “common factors” and the remaining variance is unique (11.3%) (Gorsuch, 1983, p.29). Therefore, 11.3% of the unique variance of item 6 cannot be attributed to the common factors; rather, it is attributed to factors outside this model. In addition, 82.7% of the variance for item 1 and 81.4% of the variance for item 2 are due to the “common factors,” with the remaining 17.3% and 18.6%, respectively, being unique (Gorsuch, 1983, p.29).
DISCUSSION
Survey tool development is a complex, intentional, and iterative process, and it may be aided by sought feedback as well as focused analyses including IIOC and CFA. During development of the Short Composting Survey, the researchers decided to focus on the following constructs: perceived benefits and barriers, value and importance, subjective norms, and knowledge about composting. The IIOC results indicated that all of the questions written for the survey measured more than one construct, meaning they should be revised before administration. With regard to the factor analysis, the low factor loadings on items 5 and 8 indicated that these items should be removed from the next version of the survey, whereas items 1, 2, and 6 should be retained due to their high communalities.
In the results from the IIOC, the low index of congruence for the item, “Rate your level of agreement for this statement: compost smells bad,” was particularly compelling. The calculated index of congruence of 0.29, meaning that this item was not congruent with the barrier category, indicated that the nine pre-pilot respondents did not think that the concept of “compost smelling bad” was actually a barrier to composting. The nine respondents may have been better informed than the anticipated study participants, or their views may be in agreement with most peoples, thus making odor a less salient barrier to composting.
During evaluation of the CFA factor loadings, the researchers found it helpful to choose a higher cut-off value of 0.60 rather than a lower value of 0.50 in order to assign significance to results above the higher value. There are fewer split-loadings at the higher value, and two items (5 and 8) are below the cut-off value. Item 5 (“Compost smells bad”) does not appear to address a true barrier to composting for the participants. During the initial IIOC analysis, Item 5 was assigned to the barrier category due to the assumption that the smell of decomposing organic materials inside the house would be a deterrent for most people. The factor loading of Item 5 within the barrier factor was quite low (-0.065), indicating that the smell of compost was not a deterrent for our participants. The next version of the Short Composting Survey should omit this item, as it doesn’t appear to be a barrier to composting (at least to the current study’s participants).
Item 8 is also below the cut-off value (“Many people I know are involved with a community garden”). This item has moderate-value split loadings across all three factors, indicating that it appears to measure several concepts. Due to the ambiguous nature of this item, it would be appropriate to remove it from the next version of the survey. Items 1, 2, and 6 have the highest communalities among all nine items (0.827, 0.814, and 0.887 respectively). These high values indicate that most of the variance for all three constructs can be attributed to the common factors (ie values, social, and barriers). These three items should be retained for the next version of the survey, as they have the most relevance to the constructs of interest.
CONCLUSIONS
Due to the limitations of the Compost Project and the potential value of a useful tool in filling a gap in the literature, this paper focused on the IIOC and CFA conducted during development and analysis of the Short Composting Survey. The main strength of this study was the focused nature of the analysis. Future versions of this tool should be tested with participants from non-university populations (i.e. community gardeners, schoolchildren, homeowners, etc.). Researchers may add new questions to the Short Composting Survey, request qualitative responses to specific questions, and retain the most clearly useful questions from the existing survey. Sustainability measurement tools can be administered in many different settings and populations, and they may help researchers develop educational and other programs targeting specific behaviors of interest.
REFERENCES
Crocker, L., Algina J. (1986). Introduction to classical & modern test theory. Belmont, CA: Wadsworth Group/Thomson Learning.
Deviant, S. Factor analysis: Easy definition. (2017, Nov. 13). Retrieved from http://www.statisticshowto.com/factor-analysis/.
EPA. (2017). United States 2030 food loss and waste reduction goal. Retrieved from https://www.epa.gov/sustainable-management-food/united-states-2030-food-loss-and-waste-reduction-goal.
EPA. (2017). Reducing wasted food at home. Retrieved from https://www.epa.gov/recycle/reducing-wasted-food-home.
Gorsuch, R. (1983). Factor analysis. Hillsdale, NJ: Lawrence Erlbaum Associates.
IBM. (2018). KMO and Bartlett’s test. Retrieved from https://www.ibm.com/support/knowledgecenter/en/SSLVMB_24.0.0/spss/tutorials/fac_telco_kmo_01.html.
Yong, A, Pearce, S. (2013). A beginner’s guide to factor analysis: Focusing on exploratory factor analysis. Tutorials in Quantitative Methods for Psychology, 9(2), 79-94.
APPENDIXES
Appendix A: Index of Item-Objective Congruence Rating Form for Composting [4]
Appendix B: Index of Item-Objective Congruence Data and Calculations [5]